
Nelson+ (2019) halo-scale gas flow morphologies from TNG50.
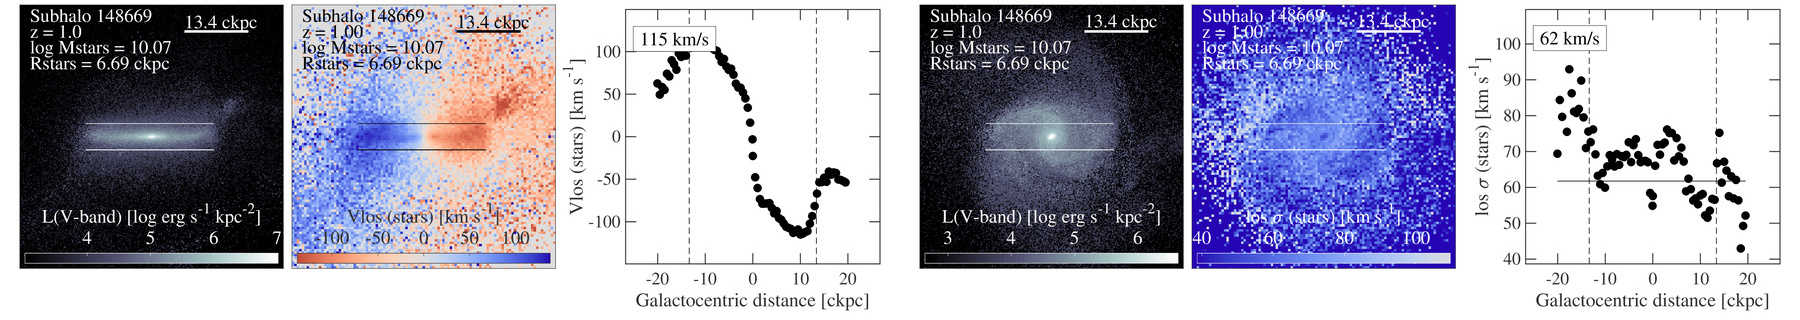
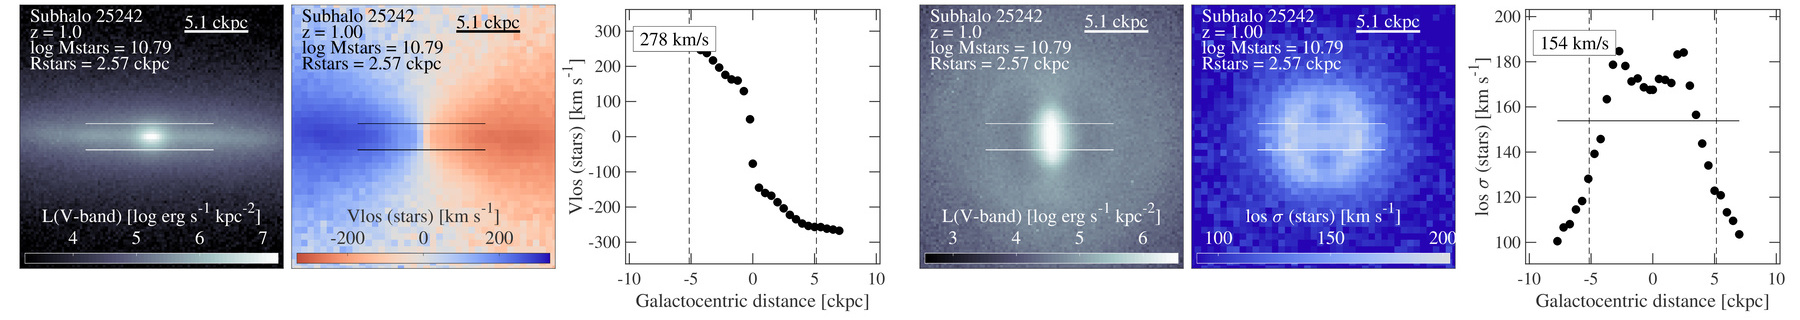
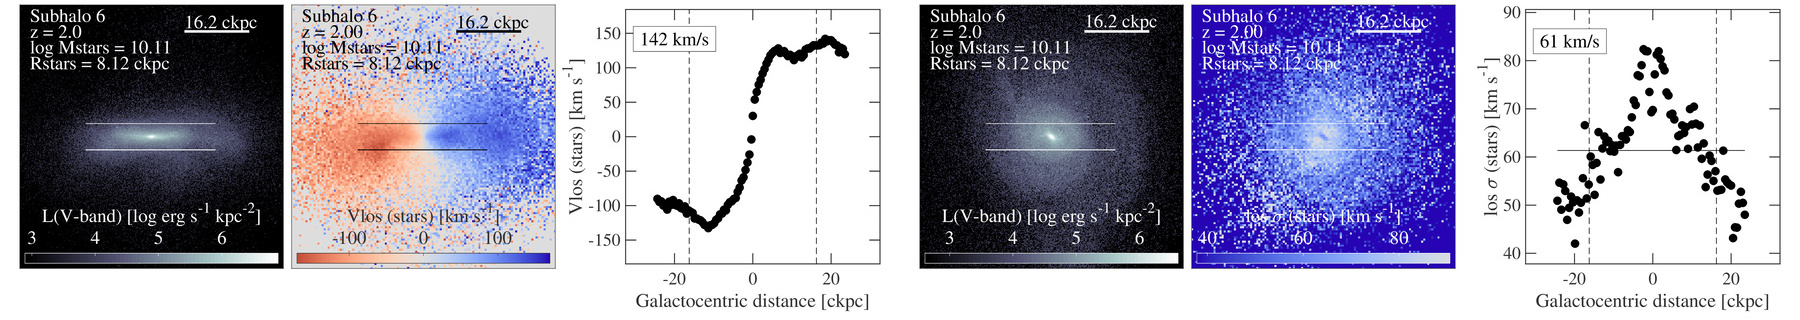
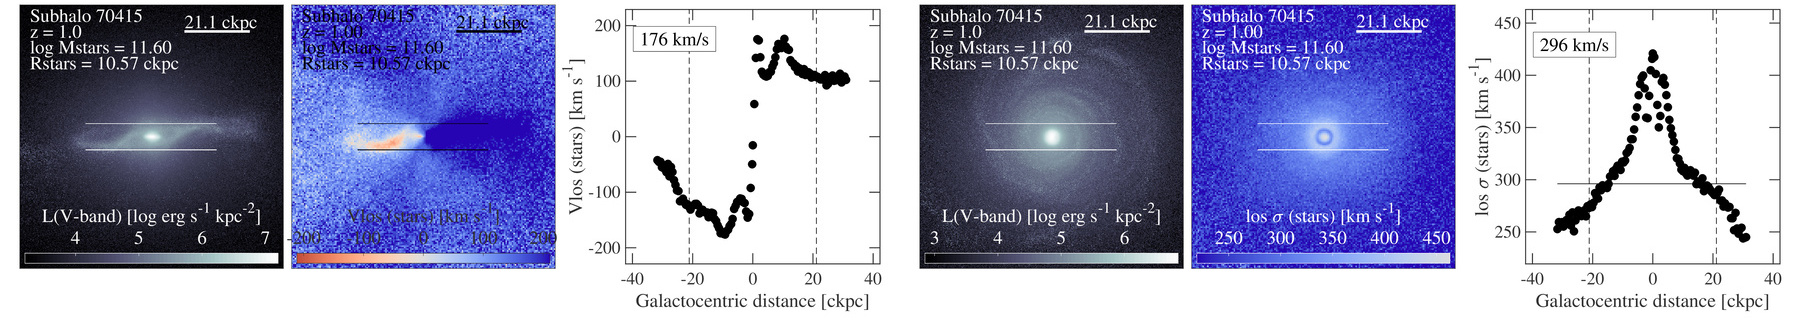
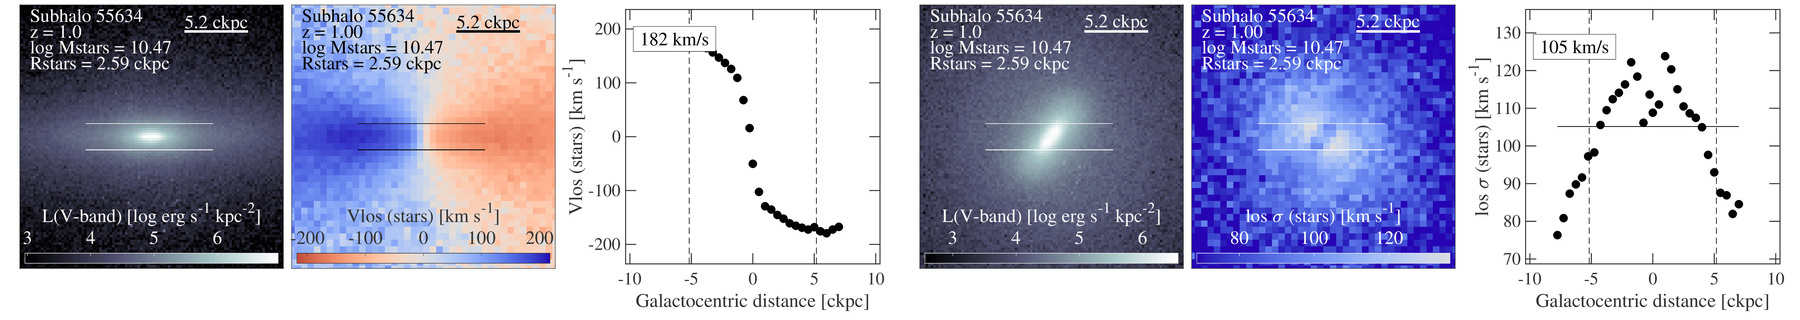
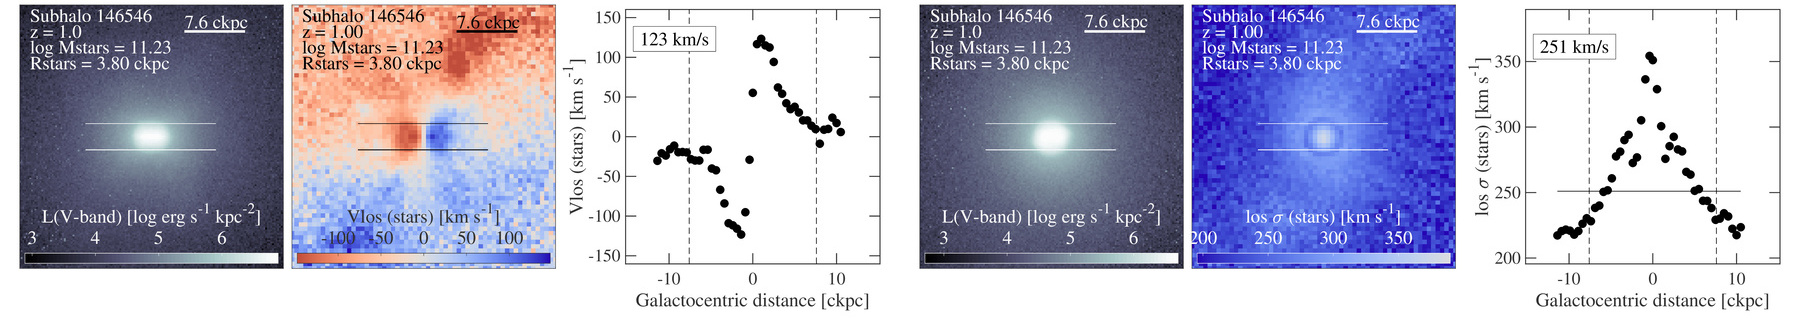
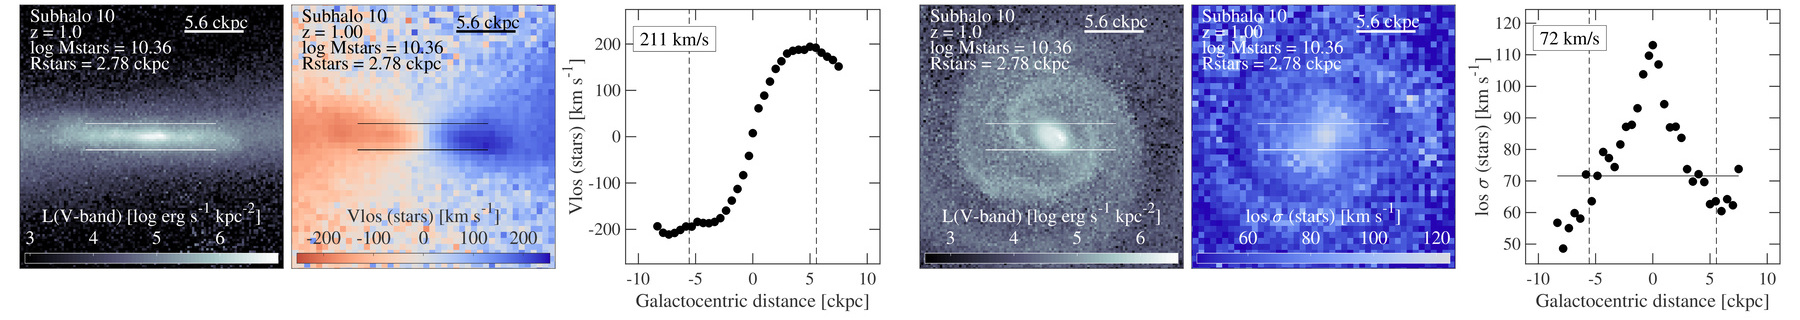
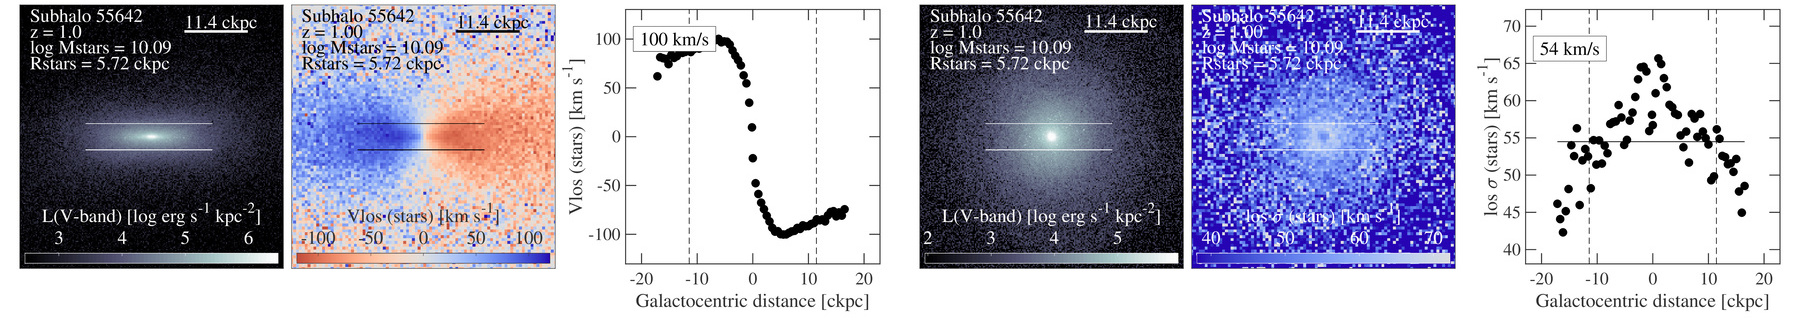
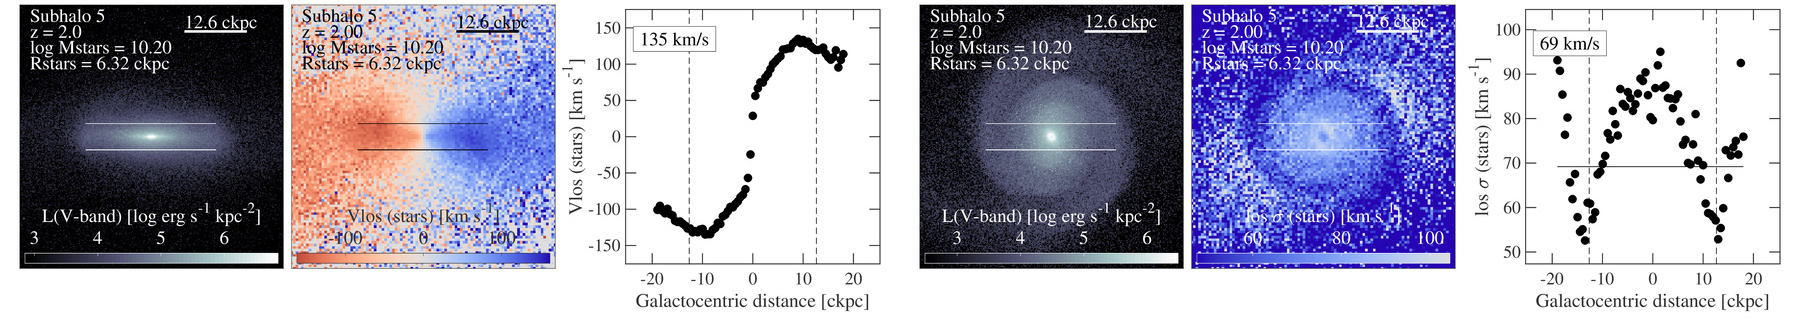
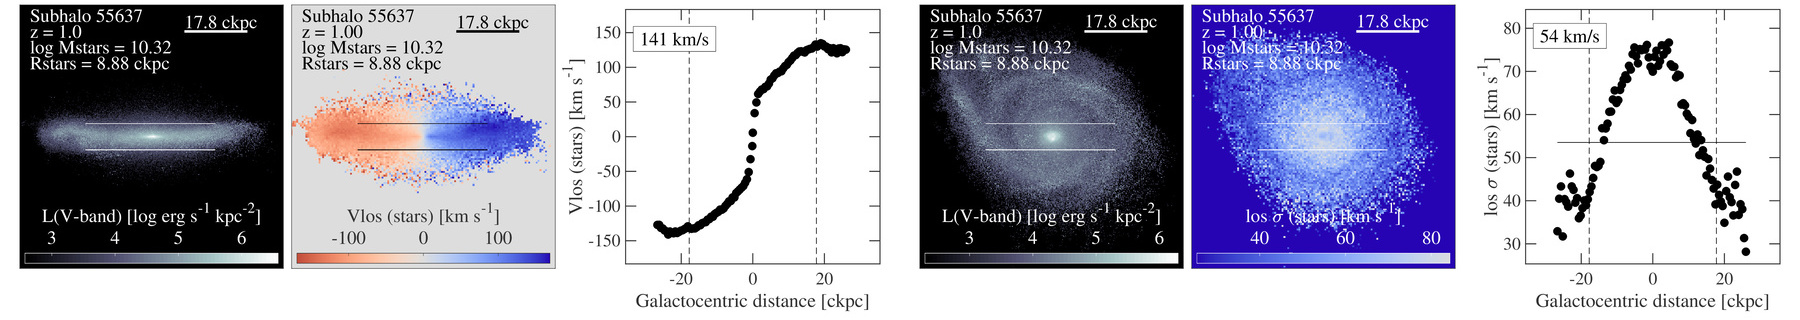
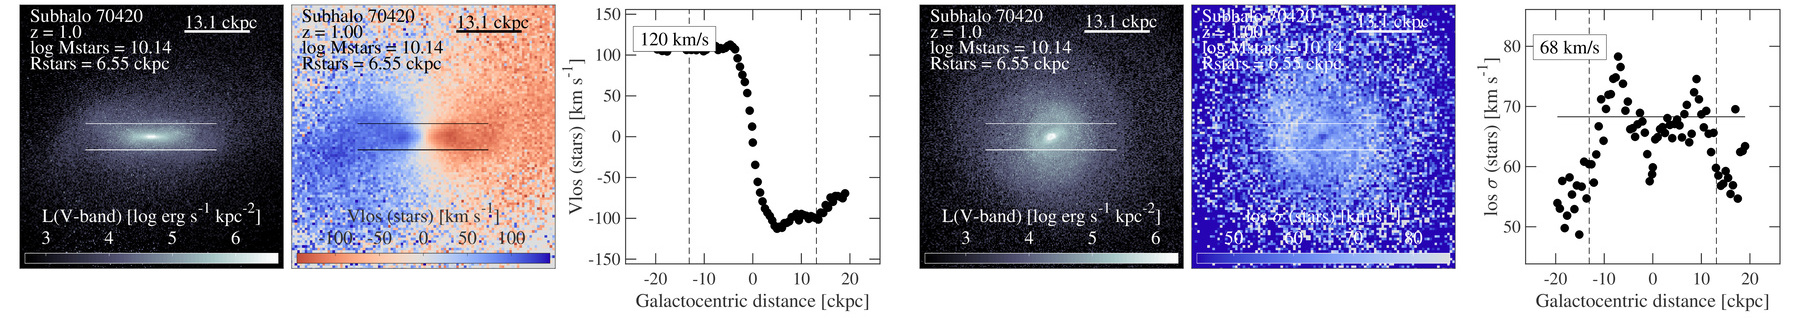
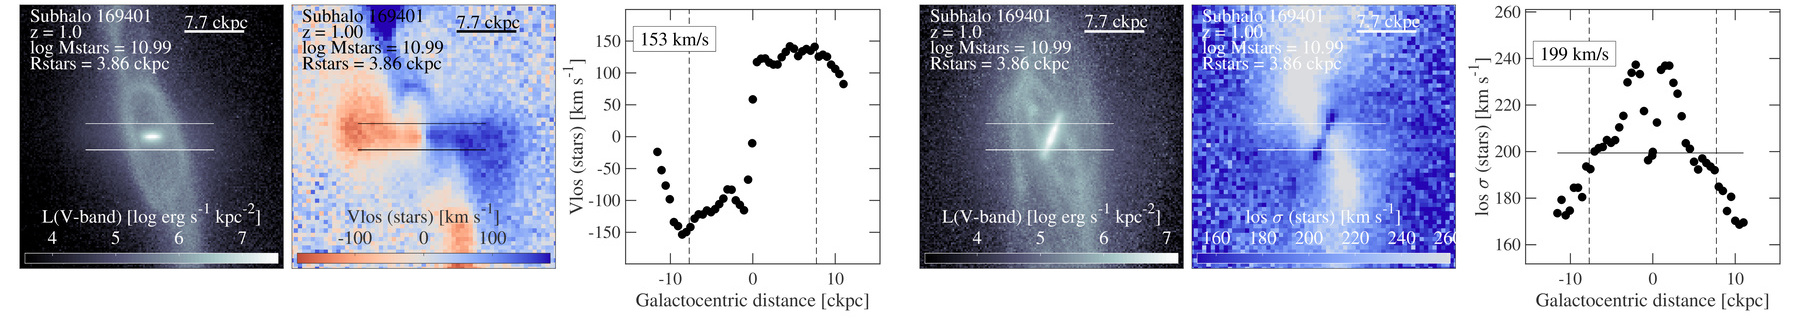
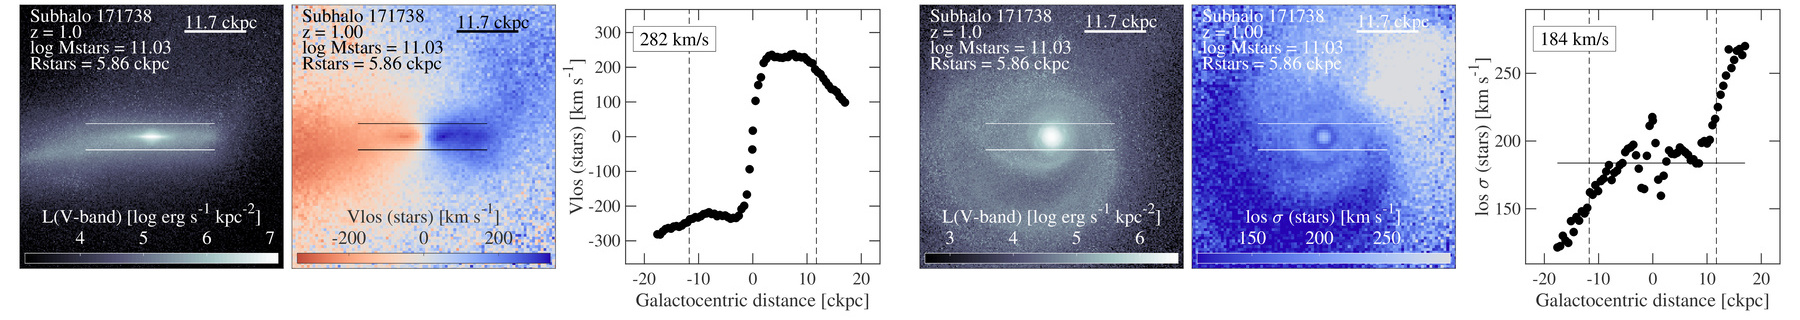
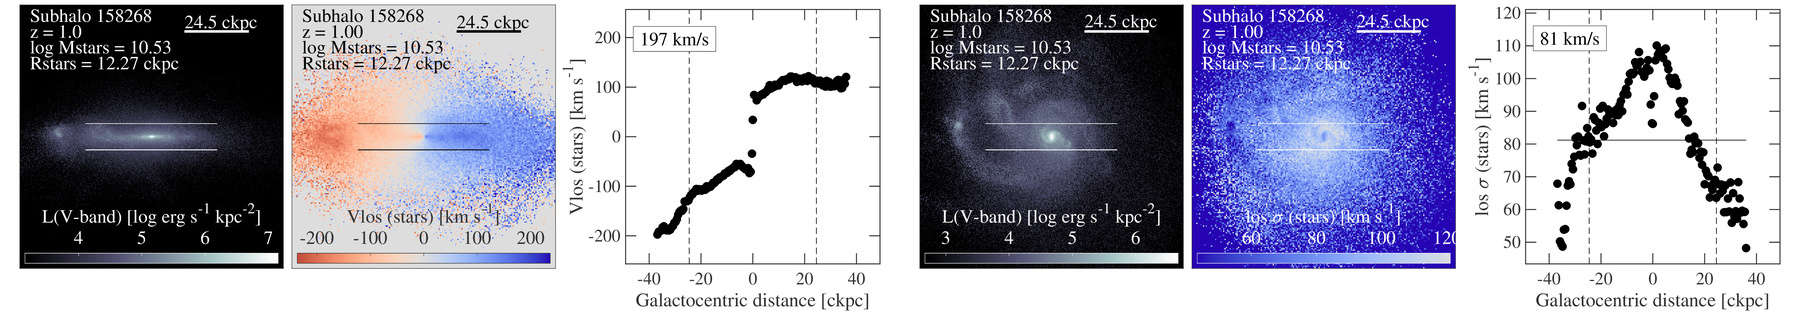
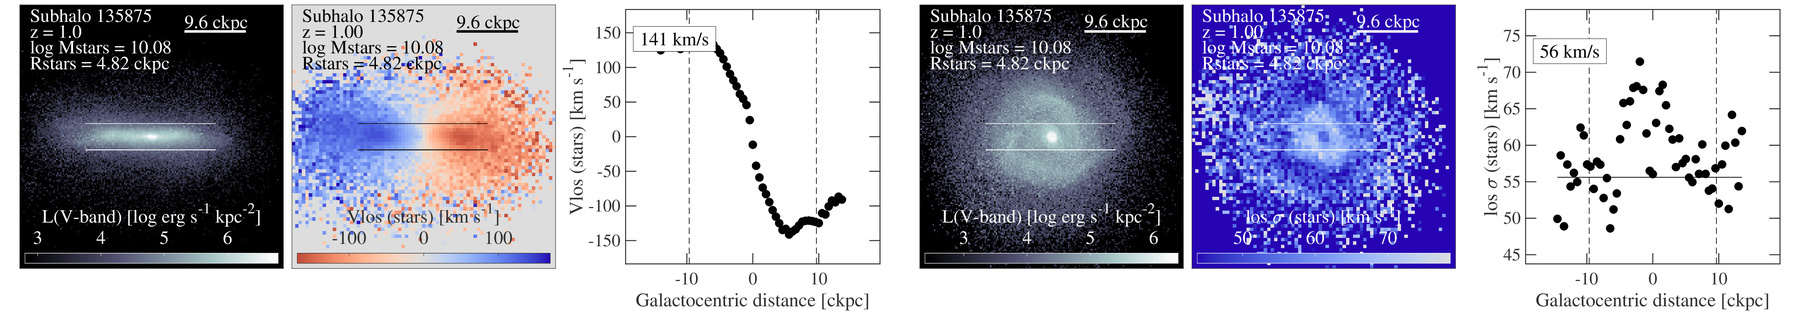
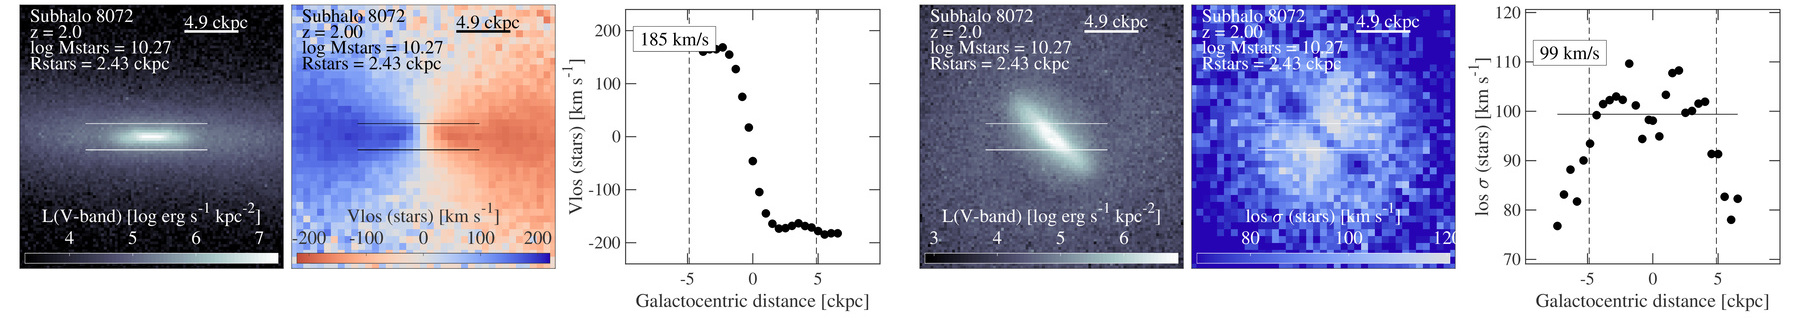
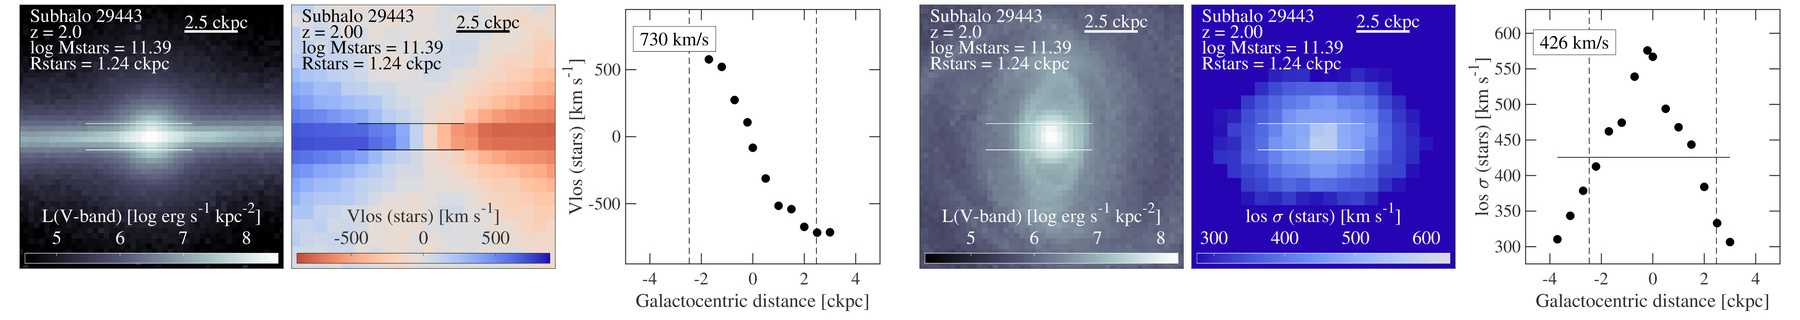
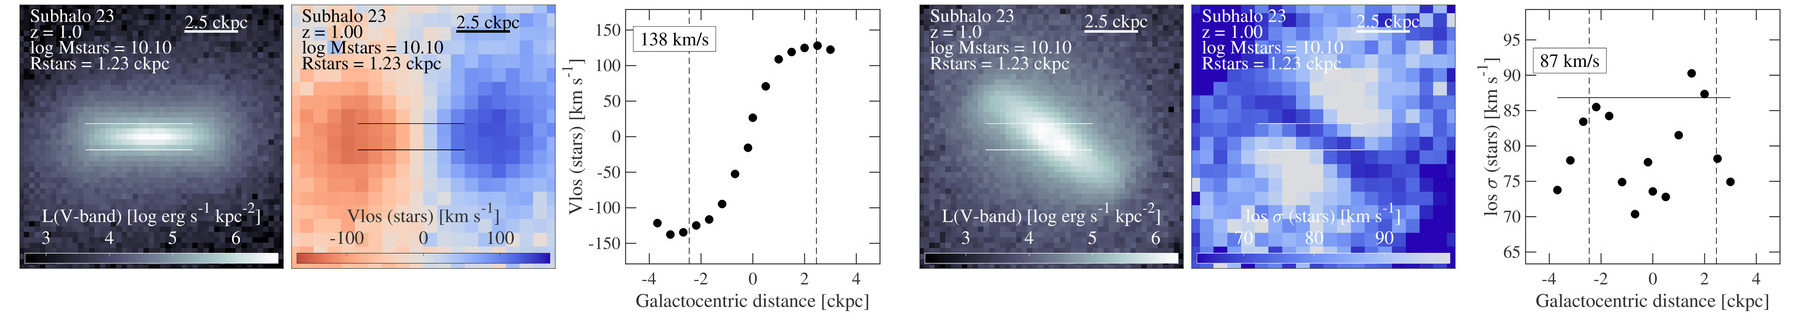
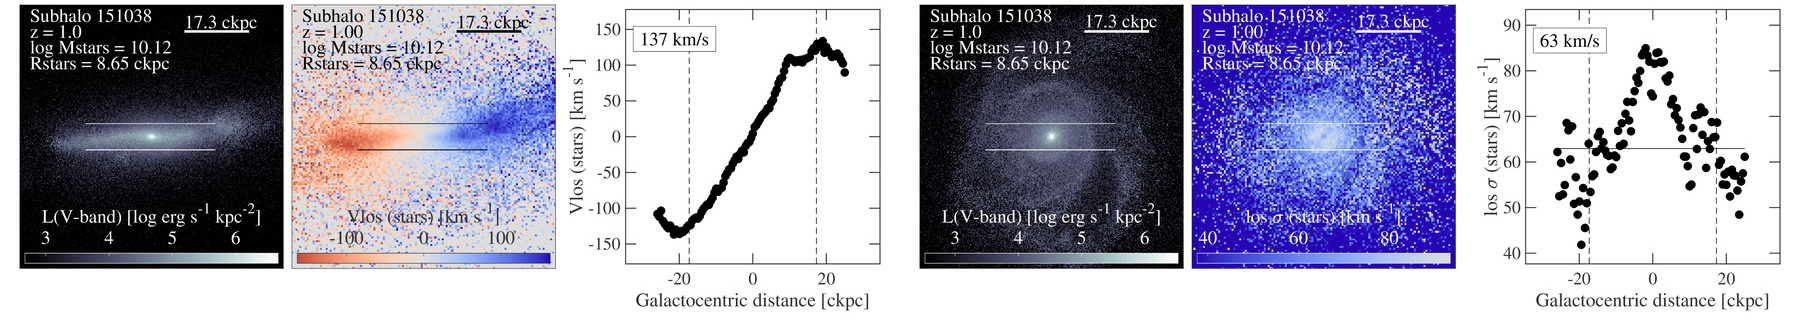
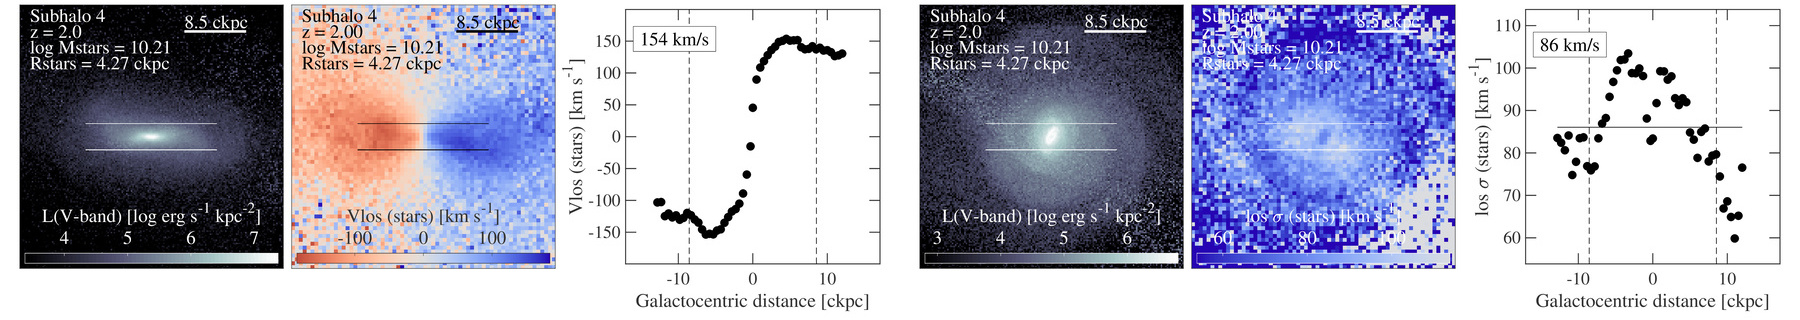
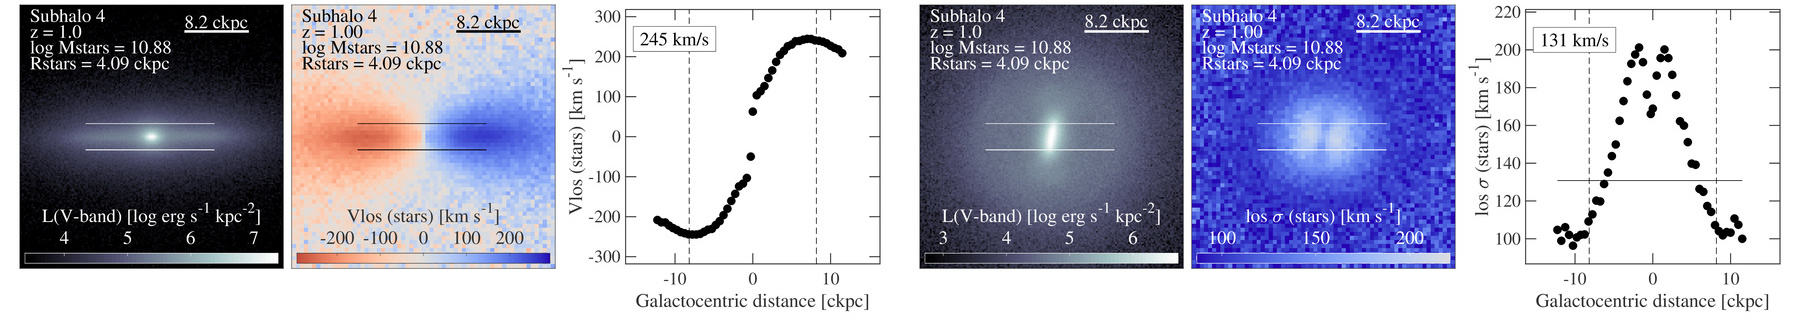
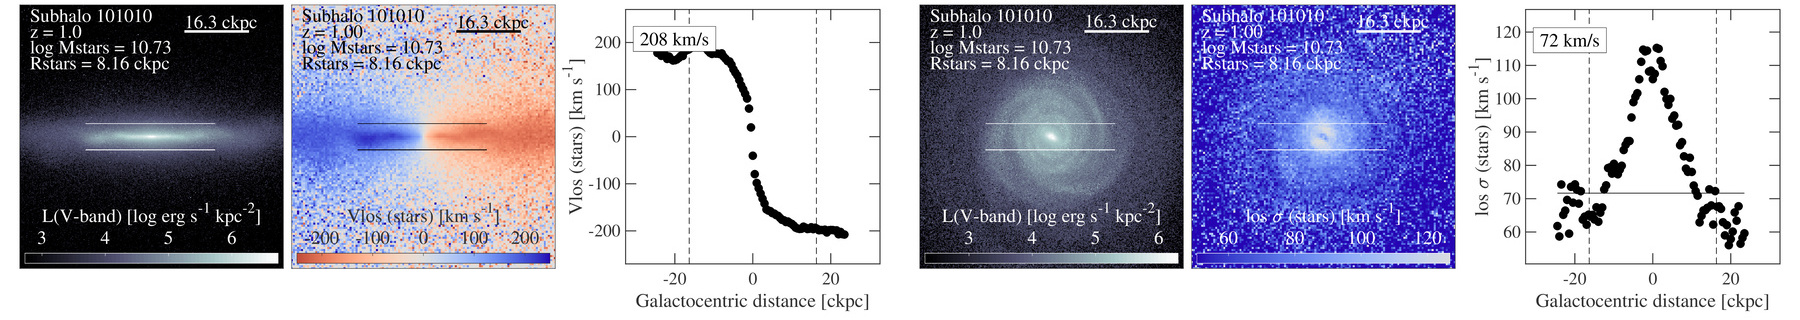
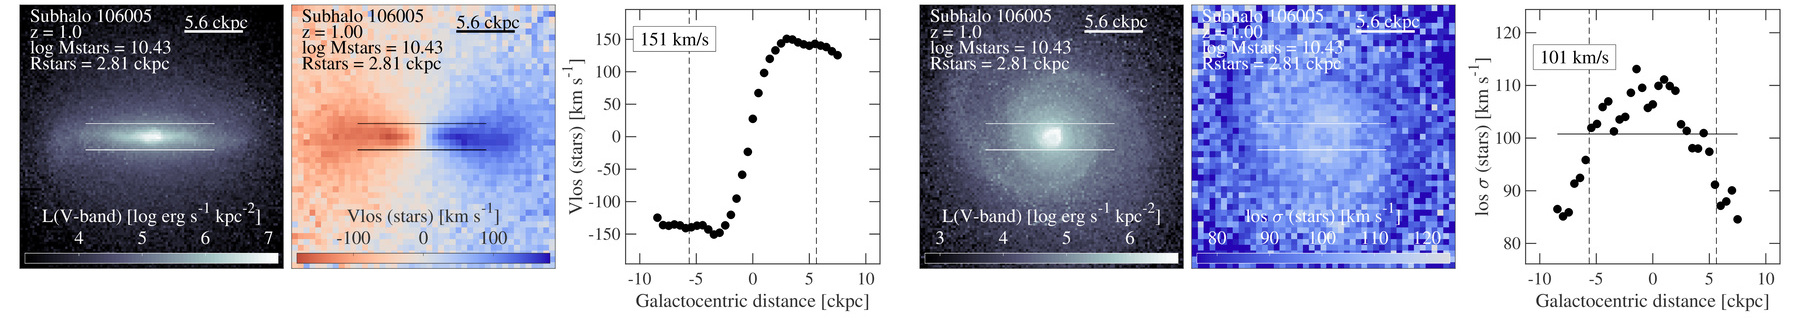
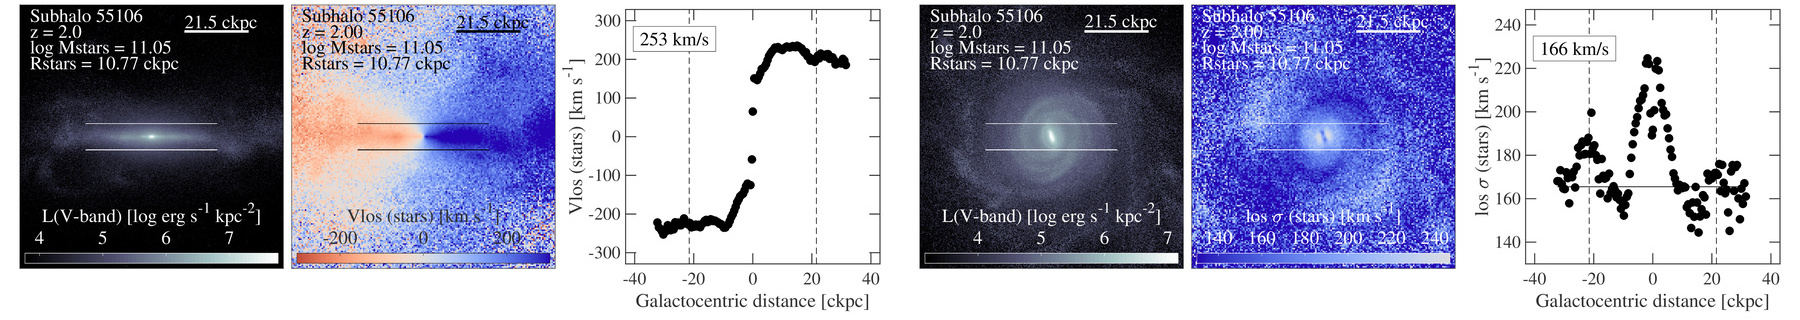
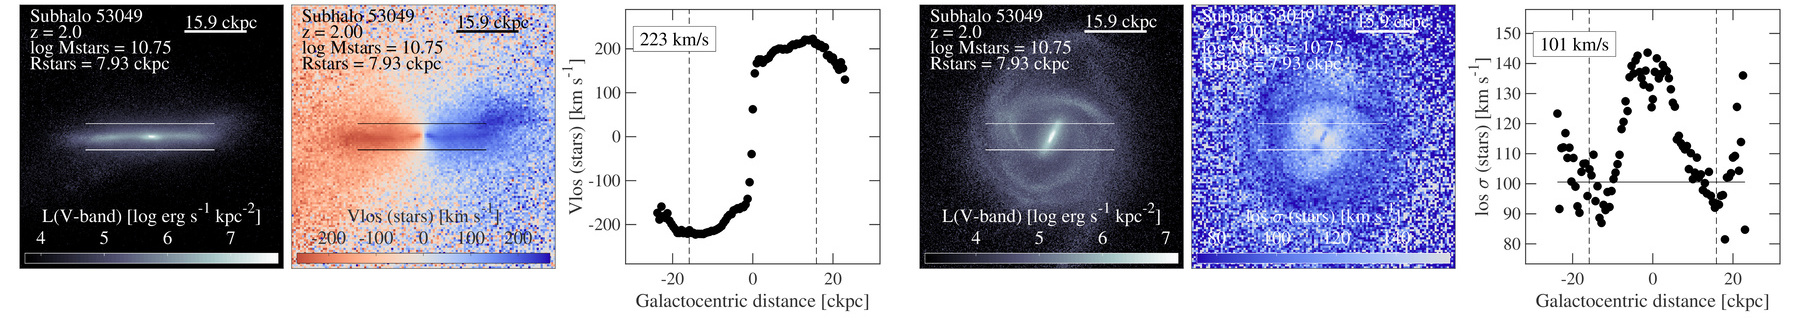
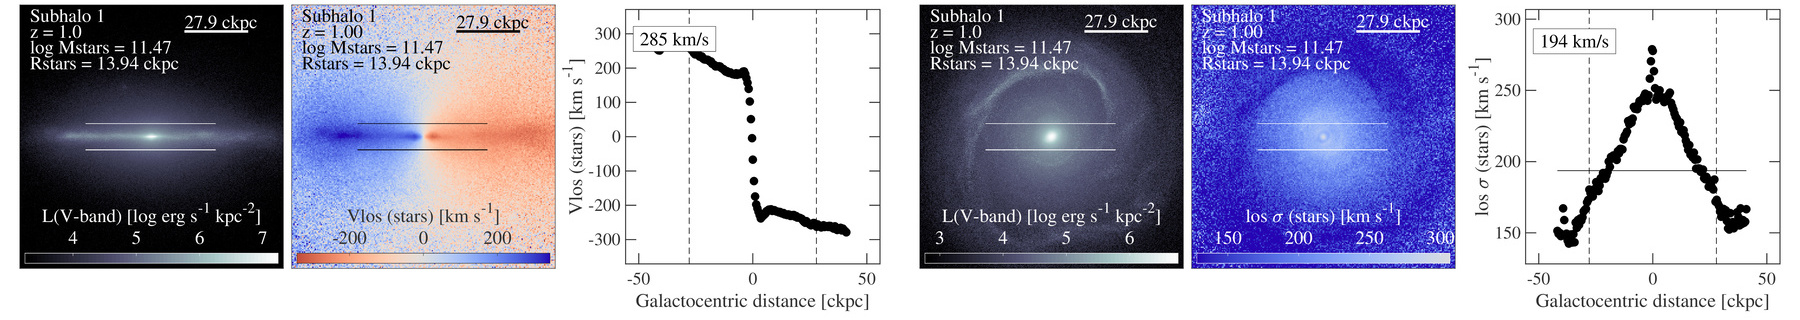
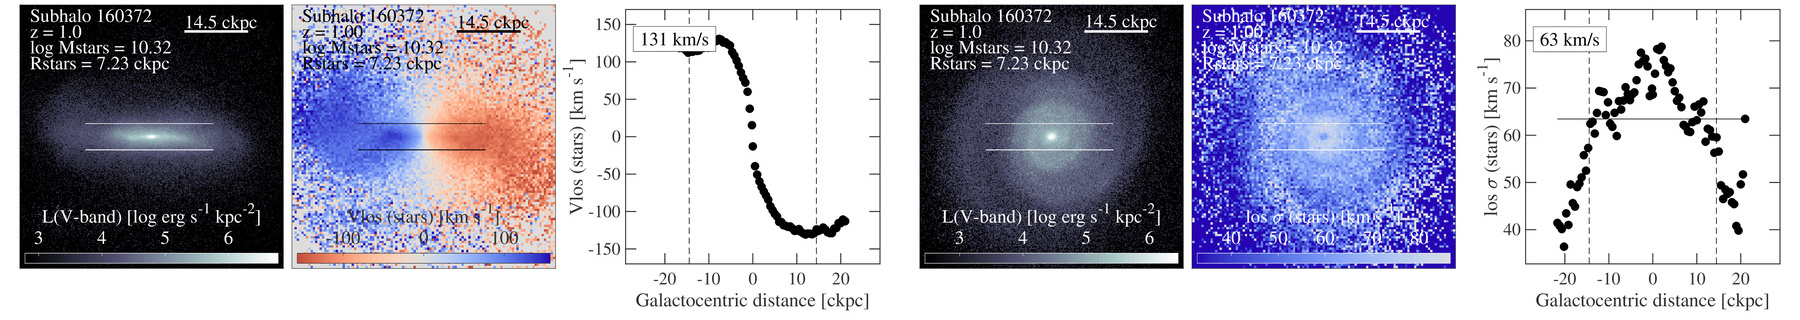
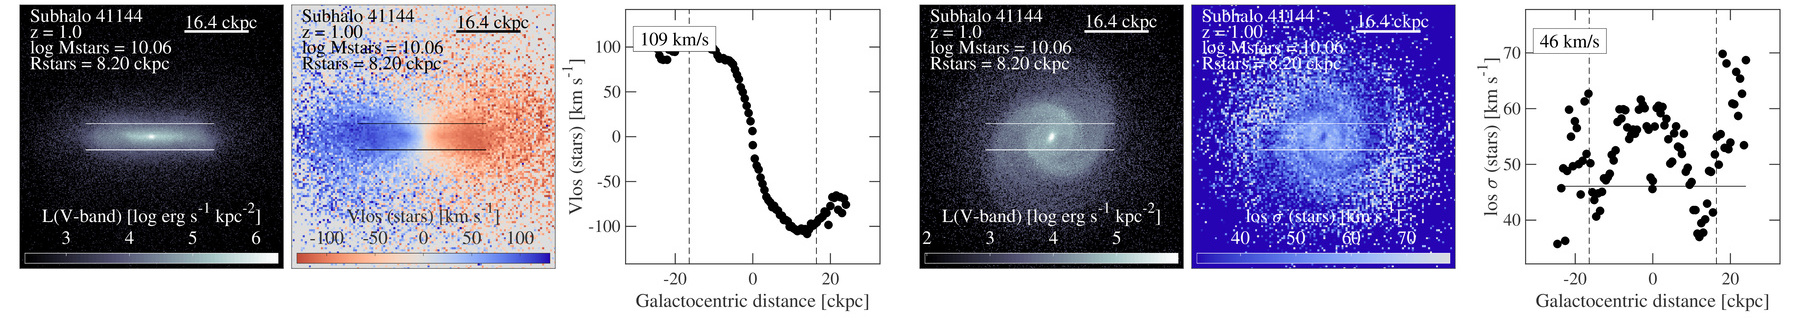
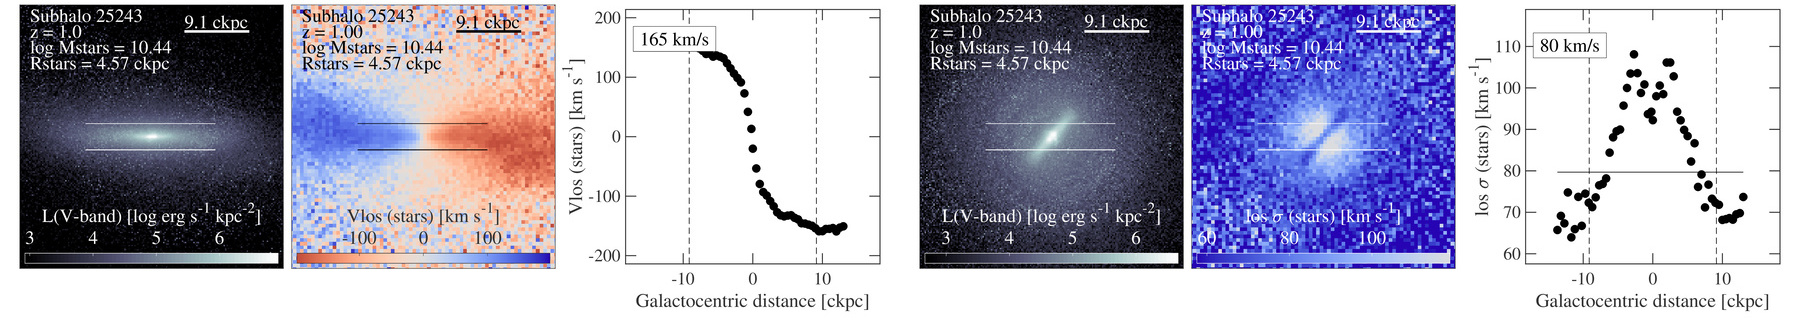
Pillepich+ (2019) galaxy kinematic maps from TNG50, stars.
Pillepich+ (2019) galaxy kinematic maps from TNG50, gas.
Rodriguez-Gomez+ (2019) stellar light images and morphological measurements for TNG50.
Rodriguez-Gomez+ (2019) stellar light images for TNG50.
Peroux+ (2020) metallicity vs radial velocity for CGM gas in TNG50.
Pillepich+ (2021) eROSITA-like X-ray bubbles in the CGM of Milky Way/M31-like galaxies in TNG50.
Ramesh+ (2023a) circumgalactic medium of Milky Way/M31-like galaxies in TNG50.
Ramesh+ (2023b) cold clouds in the CGM of TNG50 Milky Way/M31-like galaxies.
Pillepich+ (2024) sample of Milky Way/M31-like galaxies from TNG50. Stellar light images.
Pillepich+ (2024) sample of Milky Way/M31-like galaxies from TNG50. Physical properties.
Zinger+ (2023) Zooniverse Cosmological Jellyfish from TNG50 and TNG100.
Bottrell+ (2024) HSC-SSP stellar light mocks from TNG50.
Bottrell+ (2024) idealized stellar light mocks from TNG50.
V-band light maps, velocity maps and velocity profiles for the stellar component of random galaxies, from the TNG50 simulation, as in Figure 10 of Pillepich+ (2019). Galaxies with stellar mass above 1010 solar masses are shown at z=1 and z=2. In the three leftmost panels, we show edge-on projections of the stellar light and mean line-of-sight velocity, in addition to the radial profiles of the mean line-of-sight velocity along the slit depicted by the white solid lines. In the three rightmost panels, we show the face-on projections of the stellar light and of the line-of-sight velocity dispersion, in addition to the average velocity dispersion profiles along the slit. We always pixelize using square pixels of 0.5 comoving kpc to a side. For each galaxy, two numbers are indicated in the panels: stellar rotation velocity (Vrot) and stellar dispersion (sigma).
No more images.