Nelson+ (2019) halo-scale gas flow morphologies from TNG50.
Pillepich+ (2019) galaxy kinematic maps from TNG50, stars.
Pillepich+ (2019) galaxy kinematic maps from TNG50, gas.
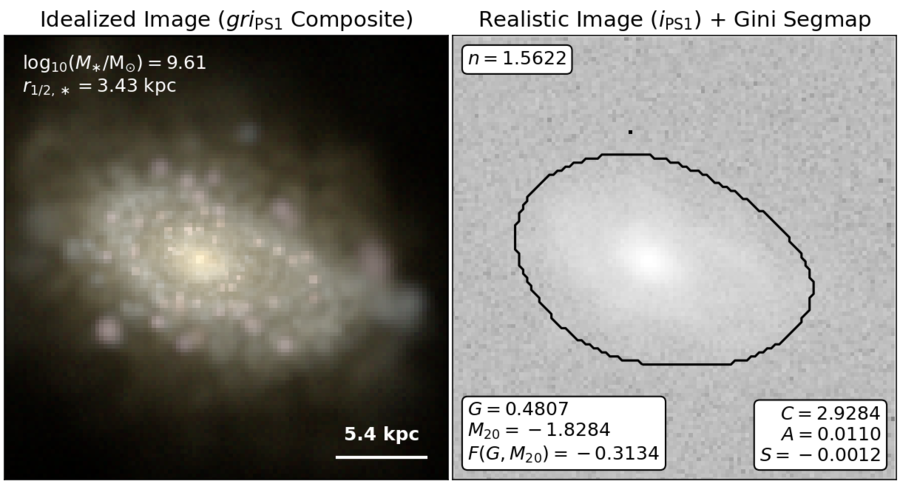
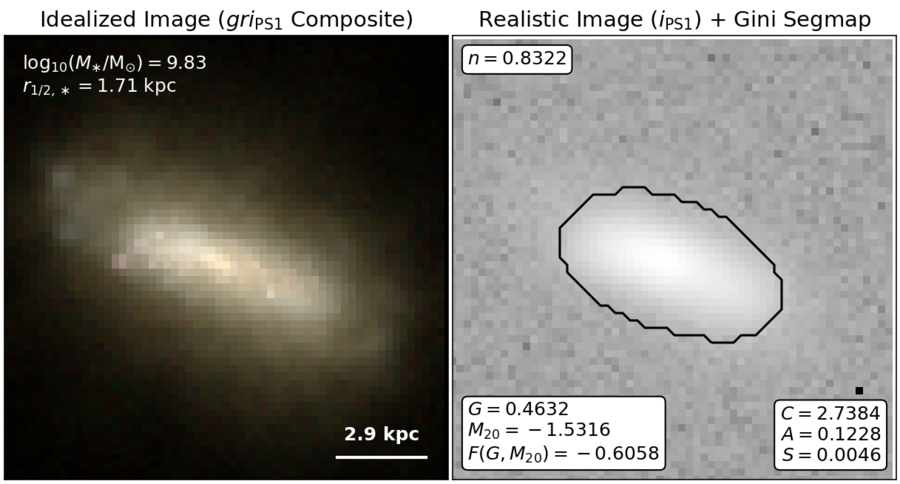
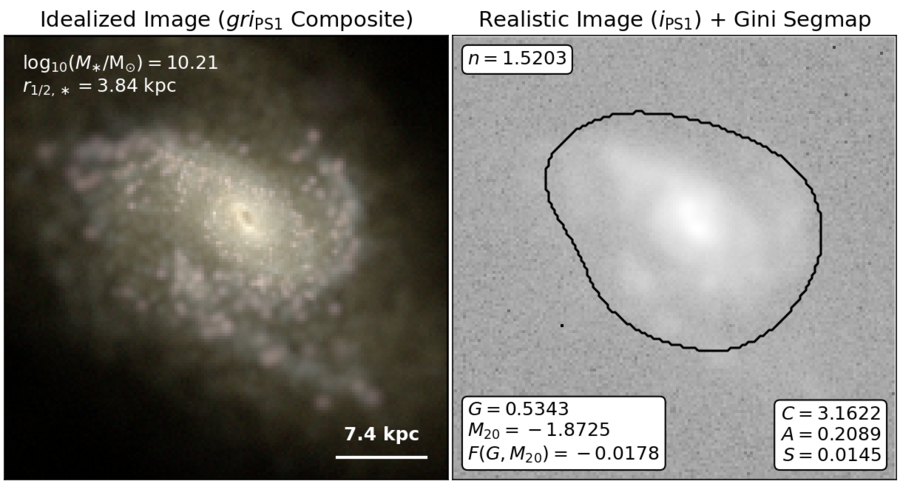
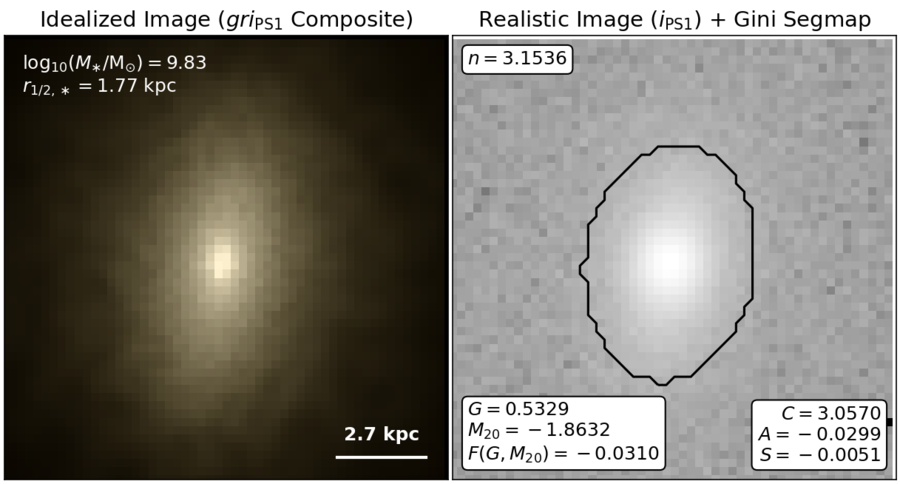
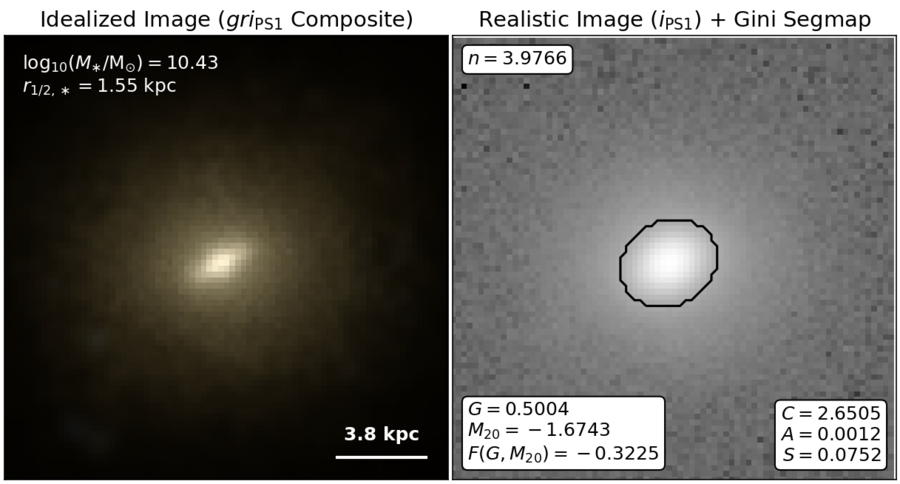
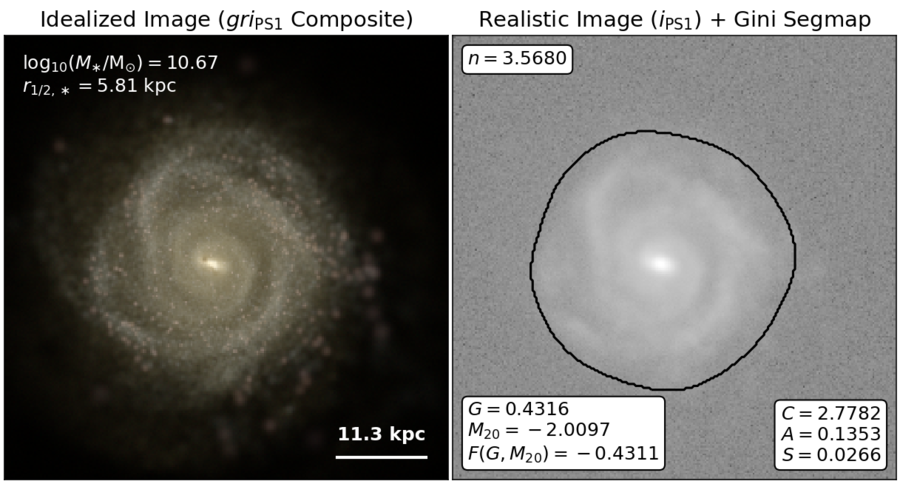
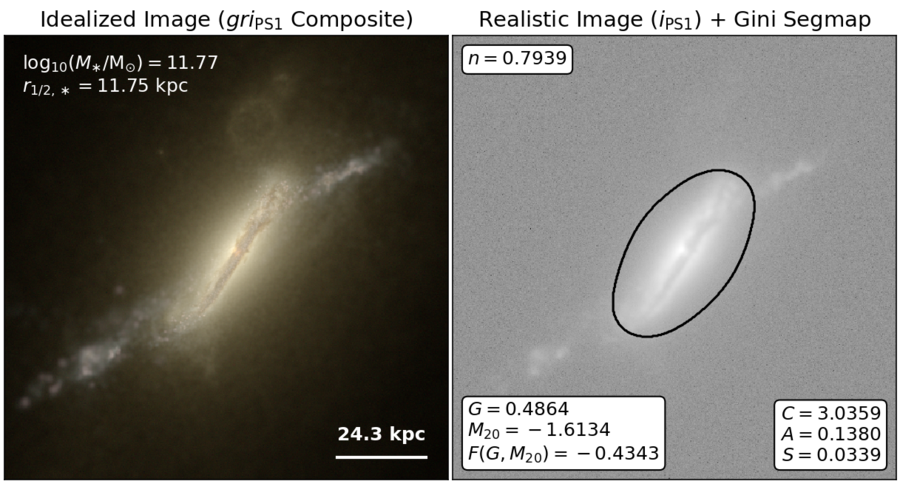
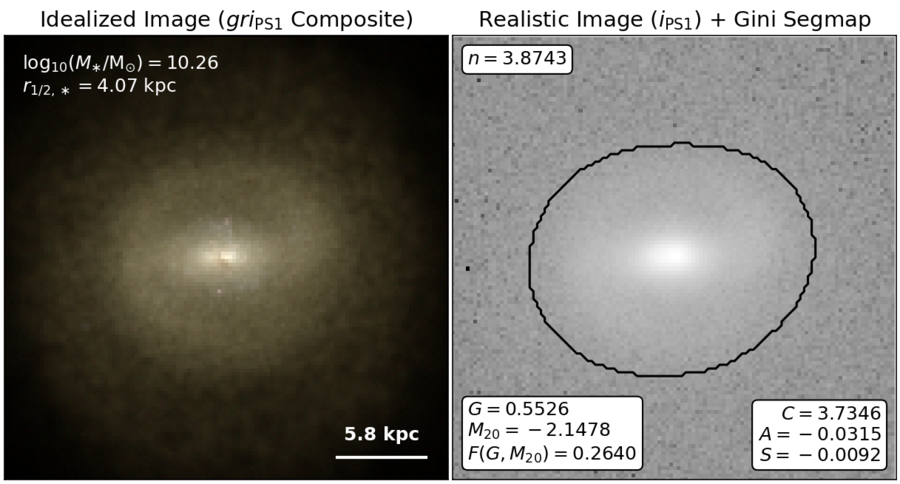
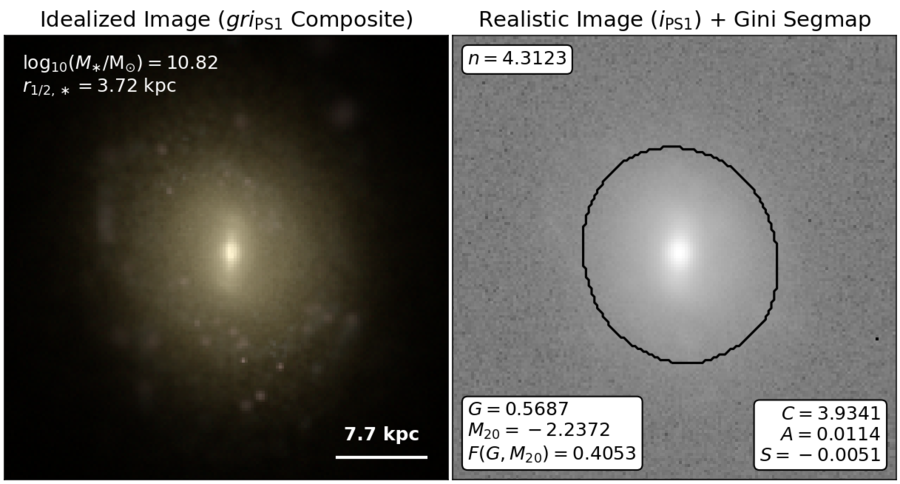
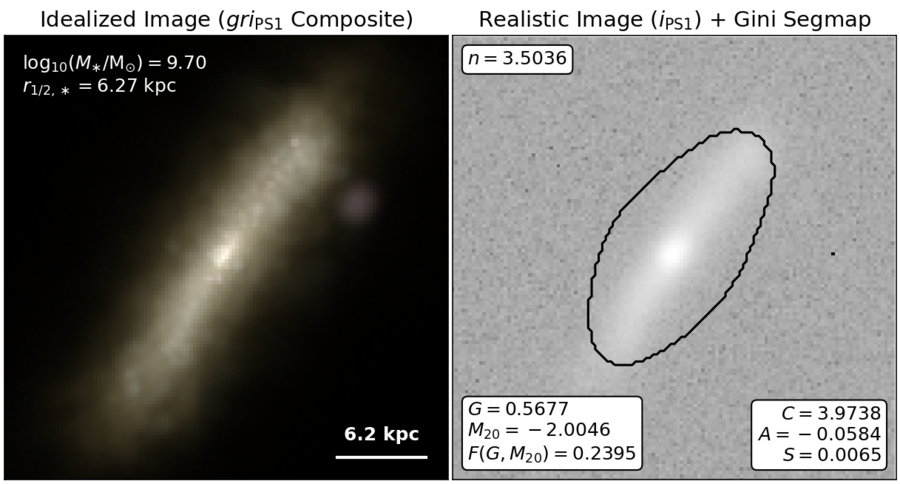
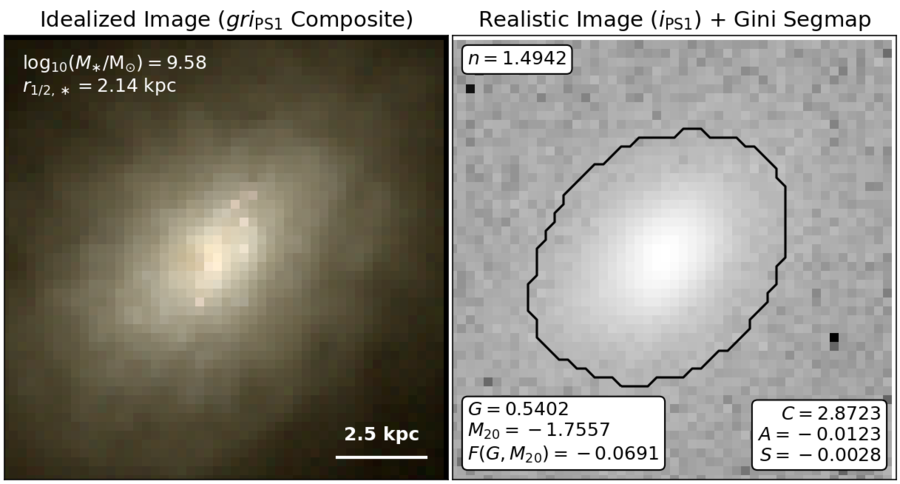
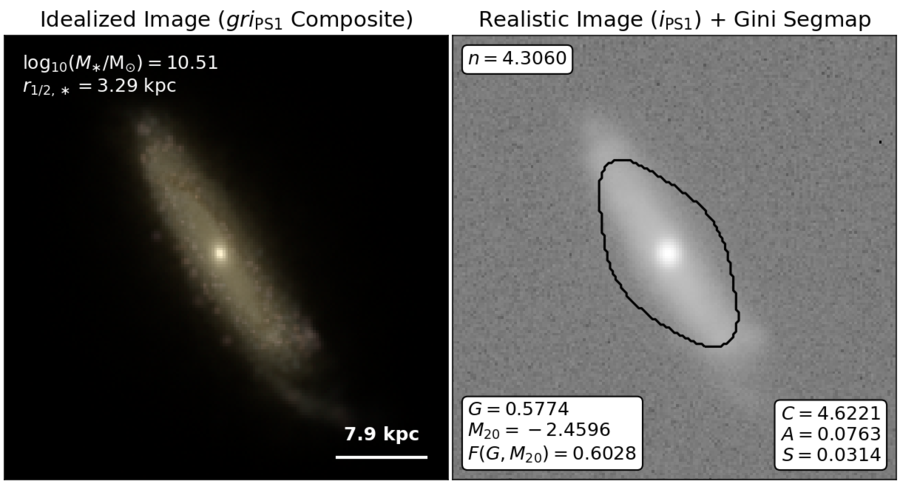
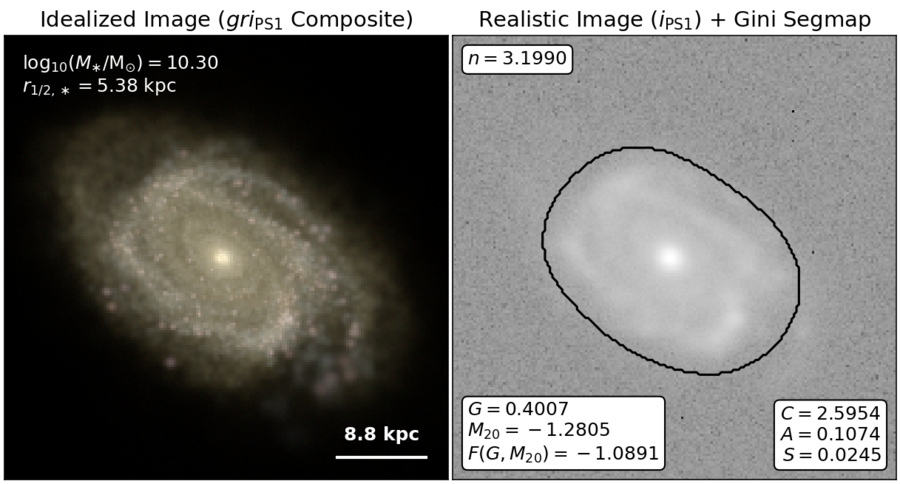
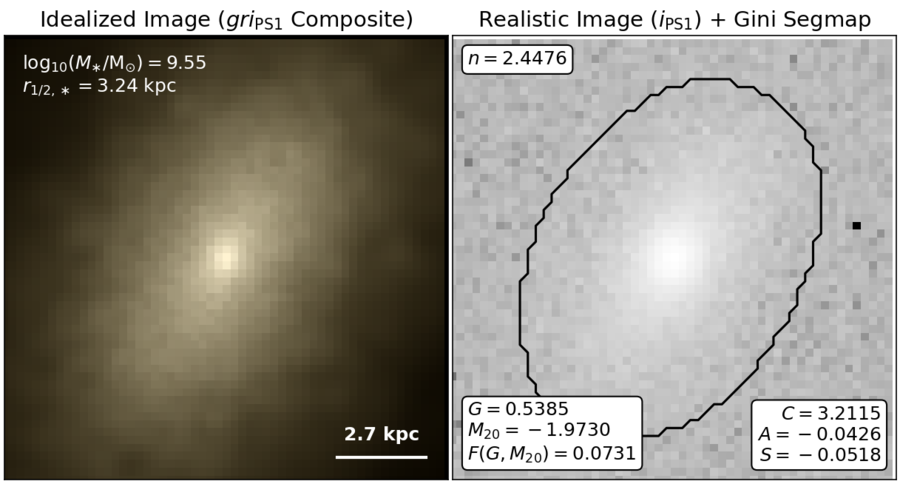
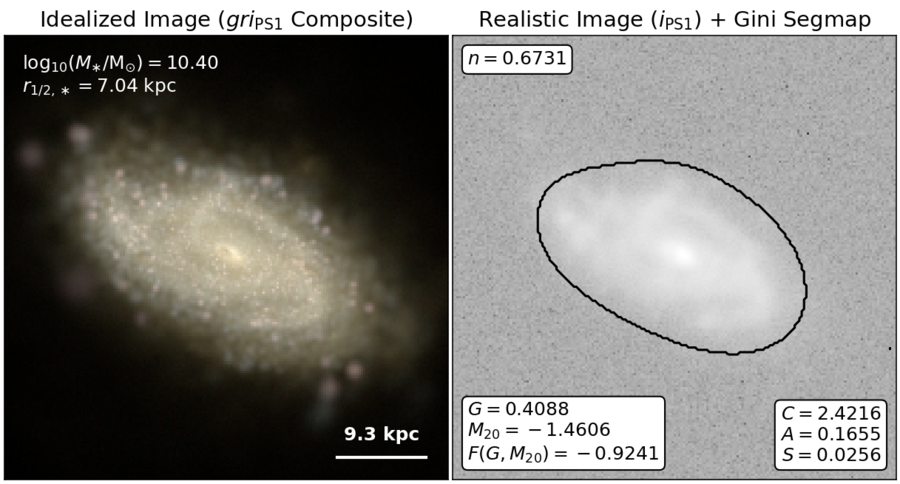
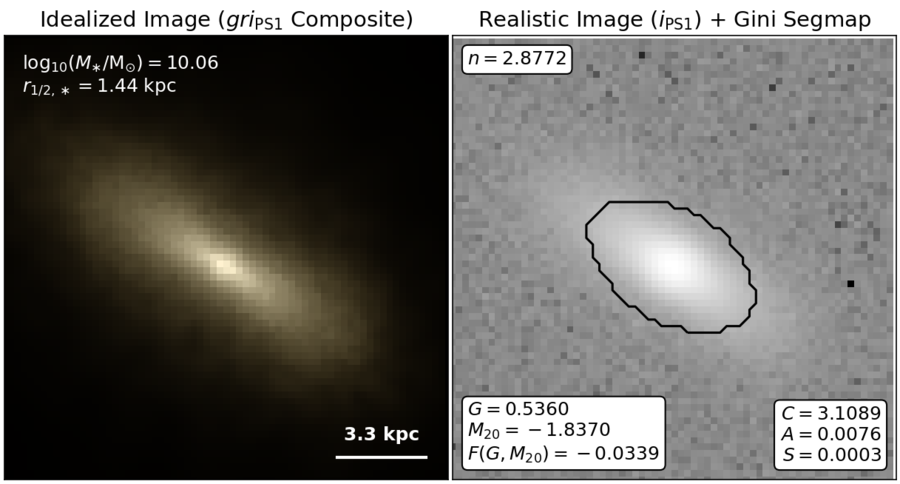
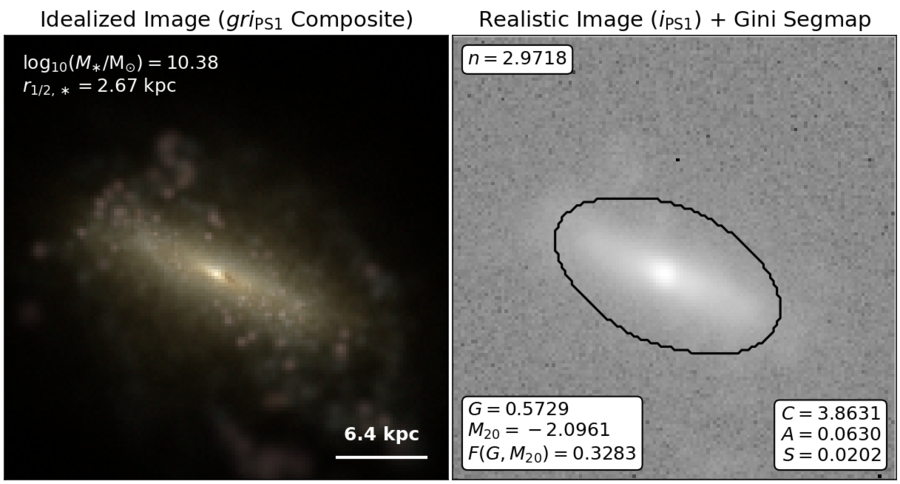
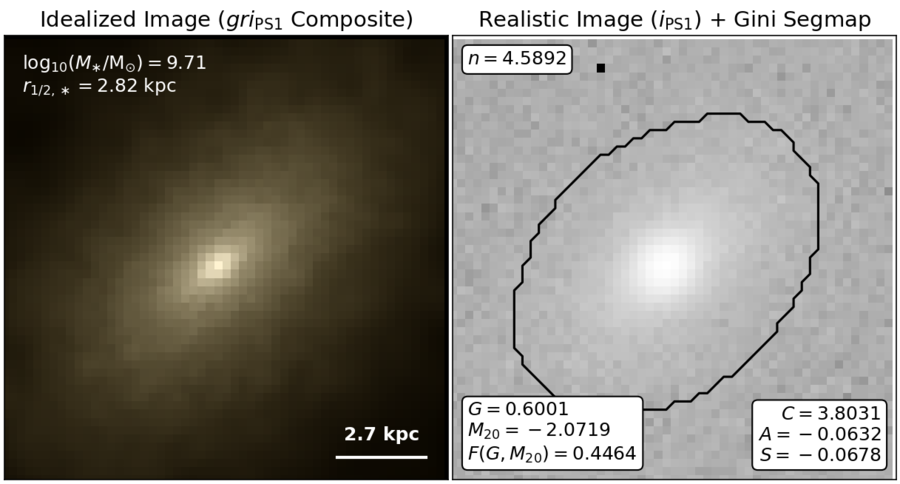
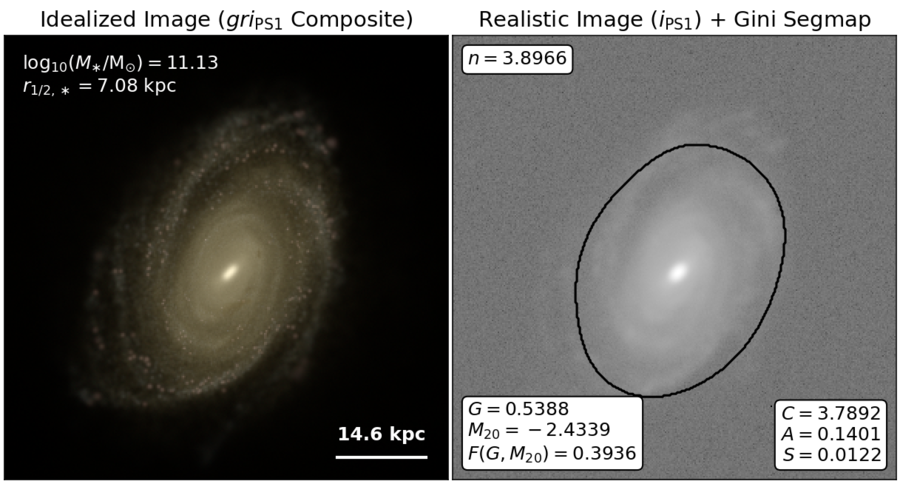
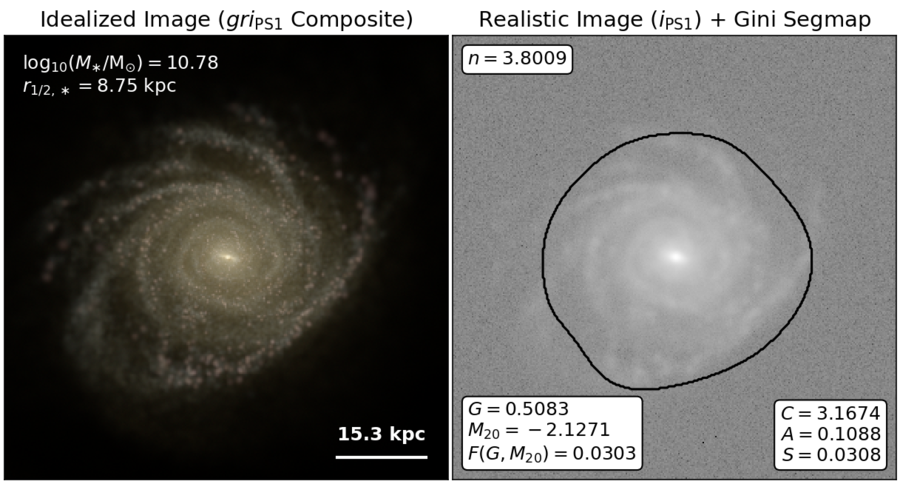
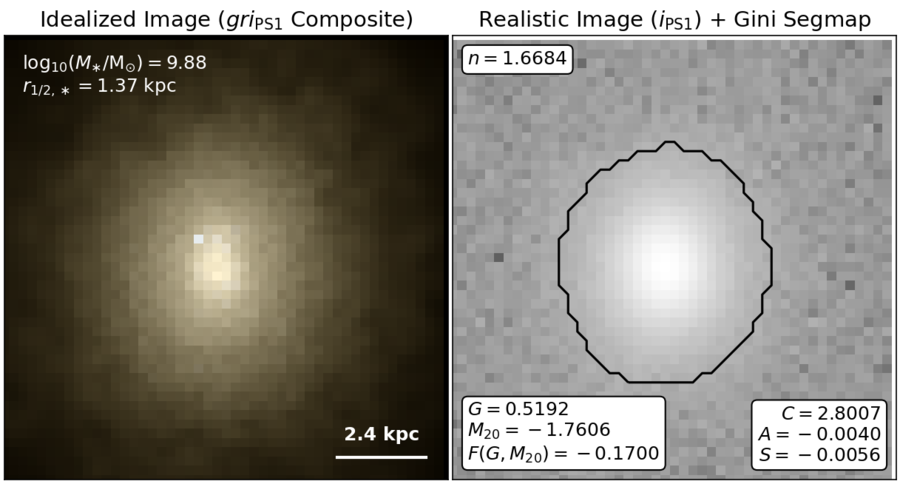
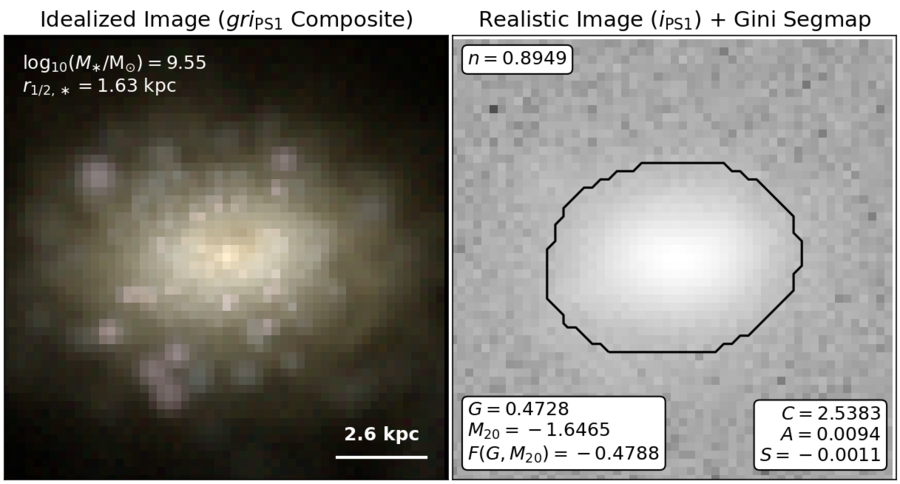
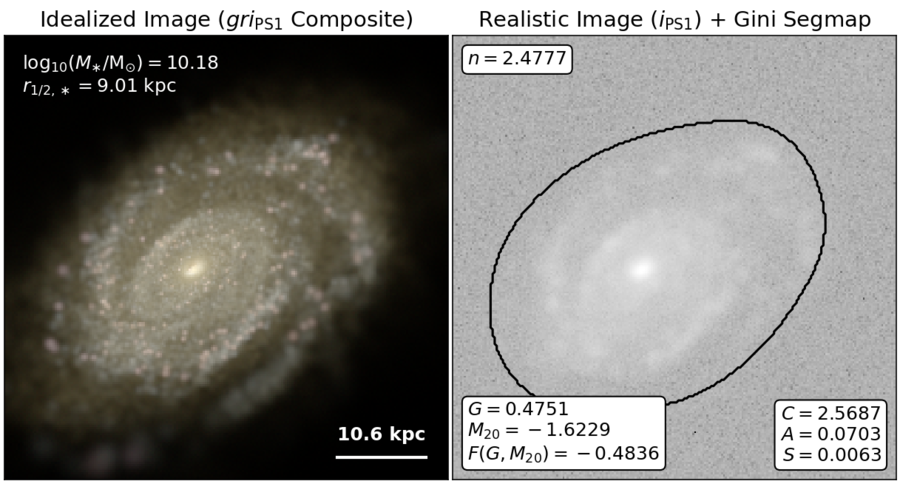
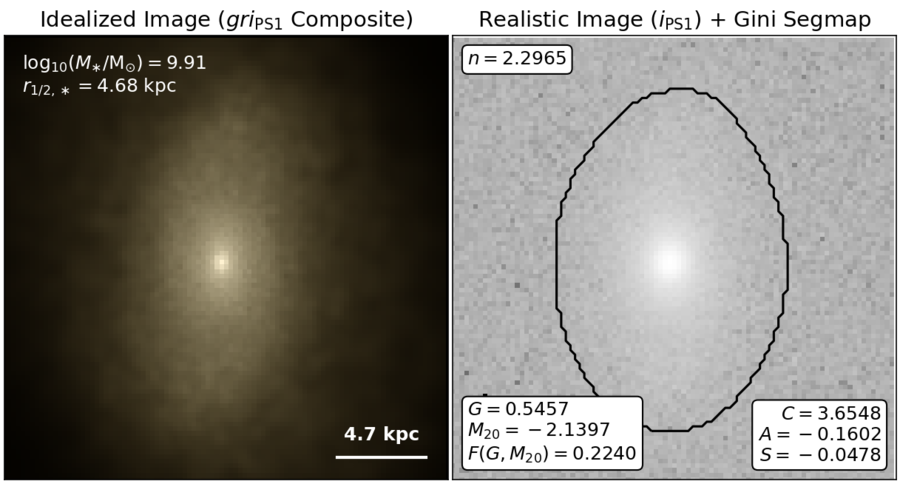
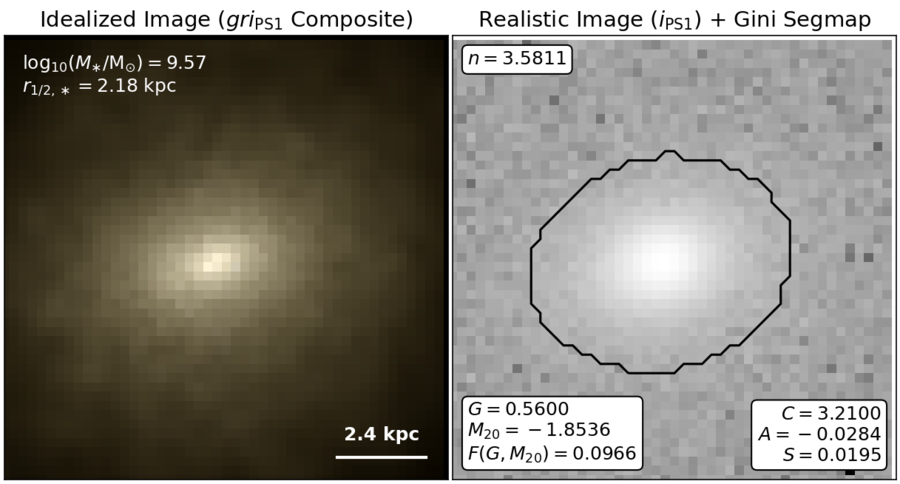
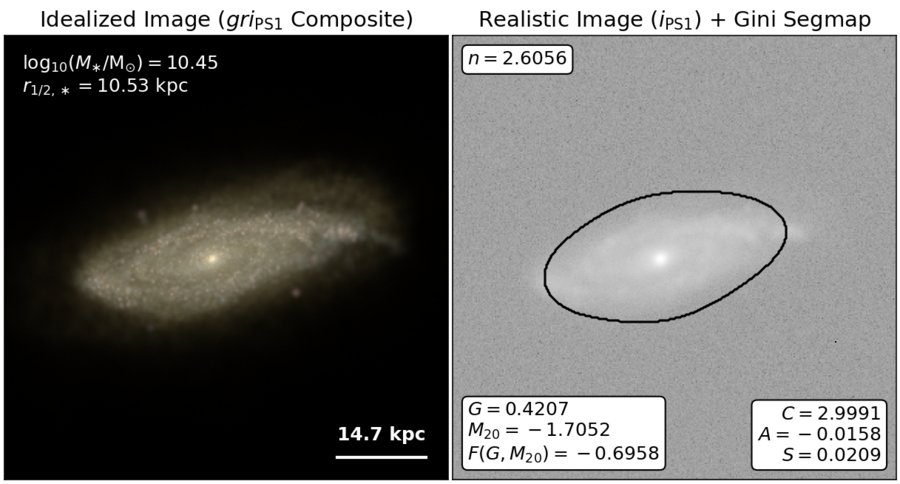
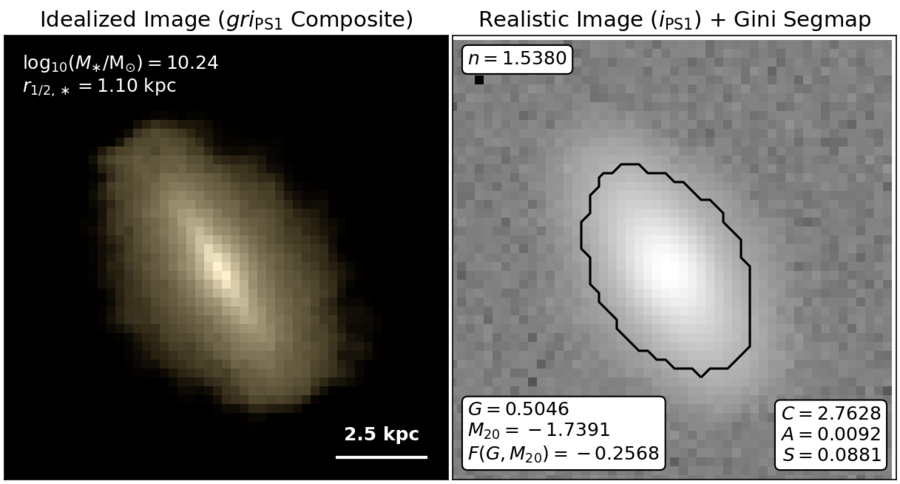
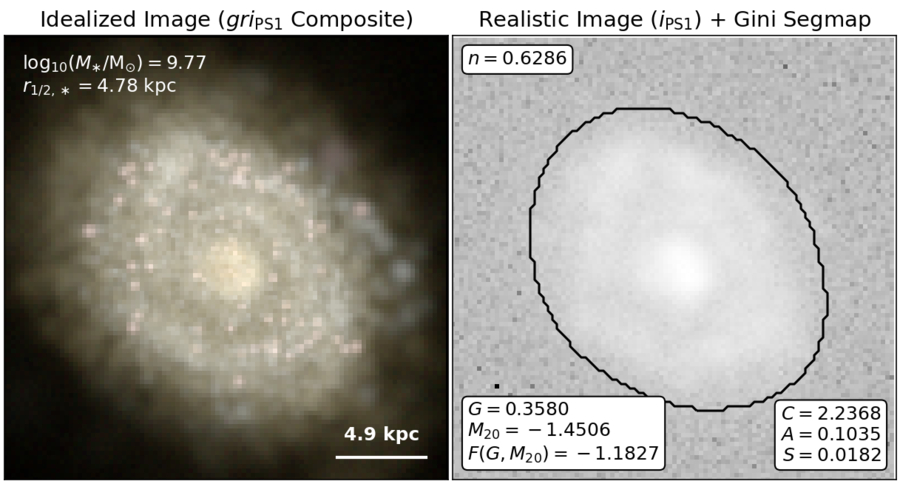
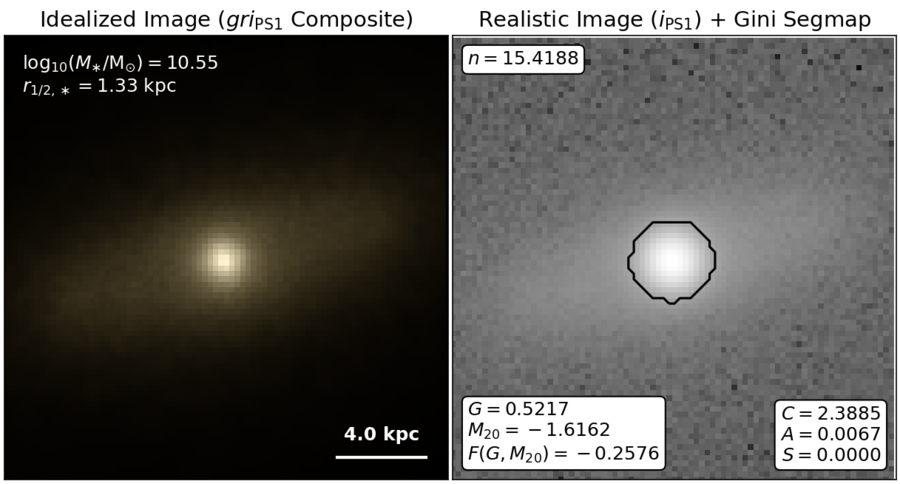
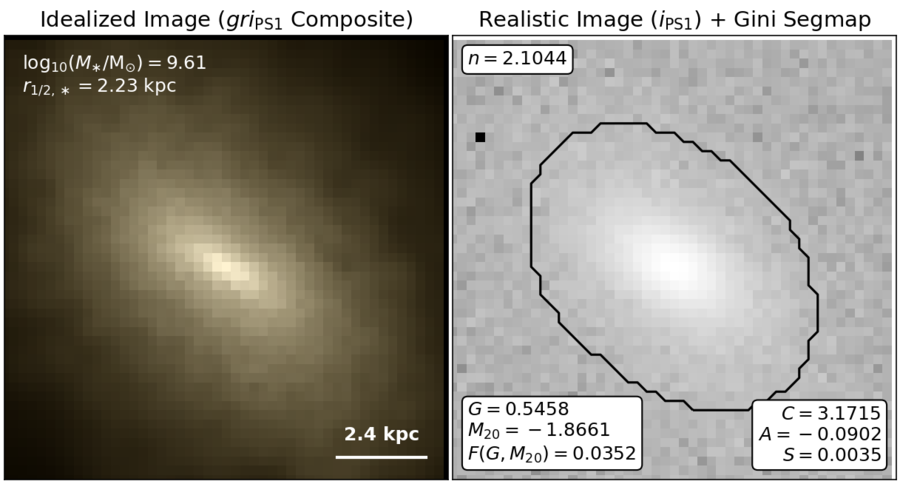
Rodriguez-Gomez+ (2019) stellar light images and morphological measurements for TNG50.
Rodriguez-Gomez+ (2019) stellar light images for TNG50.
Peroux+ (2020) metallicity vs radial velocity for CGM gas in TNG50.
Pillepich+ (2021) eROSITA-like X-ray bubbles in the CGM of Milky Way/M31-like galaxies in TNG50.
Ramesh+ (2023a) circumgalactic medium of Milky Way/M31-like galaxies in TNG50.
Ramesh+ (2023b) cold clouds in the CGM of TNG50 Milky Way/M31-like galaxies.
Pillepich+ (2024) sample of Milky Way/M31-like galaxies from TNG50. Stellar light images.
Pillepich+ (2024) sample of Milky Way/M31-like galaxies from TNG50. Physical properties.
Zinger+ (2023) Zooniverse Cosmological Jellyfish from TNG50 and TNG100.
Bottrell+ (2024) HSC-SSP stellar light mocks from TNG50.
Bottrell+ (2024) idealized stellar light mocks from TNG50.
These figures are based on Figs 3 and 4 from Rodriguez-Gomez+ (2019), but in this case we extend the analysis (originally for TNG100) to the highly detailed TNG50 simulation. Left: Idealized synthetic images (using Pan-STARRS1 g,r,i filters) of randomly selected galaxies from the TNG50 simulation, generated with the SKIRT radiative transfer code. The text labels indicate the total stellar mass and the 3D stellar half-mass radius. Right: Corresponding realistic images (i-band) obtained by adding background noise and convolving with an appropriate PSF. The text labels indicate some of the morphological measurements carried out by statmorph, specifically the Gini-M20 (Lotz et al. 2004; Snyder et al. 2015) and concentration-asymmetry-smoothness (CAS; Conselice 2003) statistics, as well as the Sérsic index (Sérsic 1968). The black contour shows the region used to calculate the Gini--M20 statistics, which roughly corresponds to a Petrosian radius.
No more images.