
Nelson+ (2019) halo-scale gas flow morphologies from TNG50.
Pillepich+ (2019) galaxy kinematic maps from TNG50, stars.
Pillepich+ (2019) galaxy kinematic maps from TNG50, gas.
Rodriguez-Gomez+ (2019) stellar light images and morphological measurements for TNG50.
Rodriguez-Gomez+ (2019) stellar light images for TNG50.
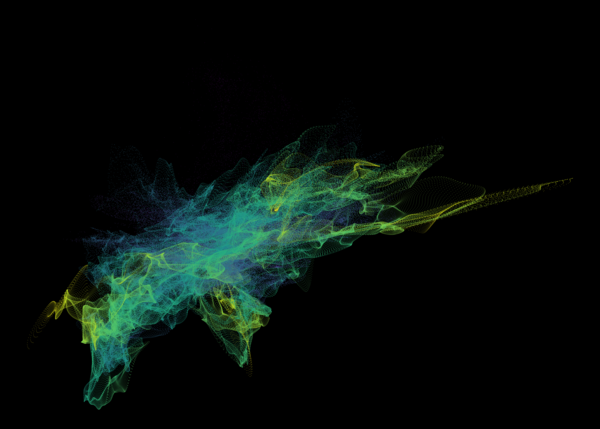
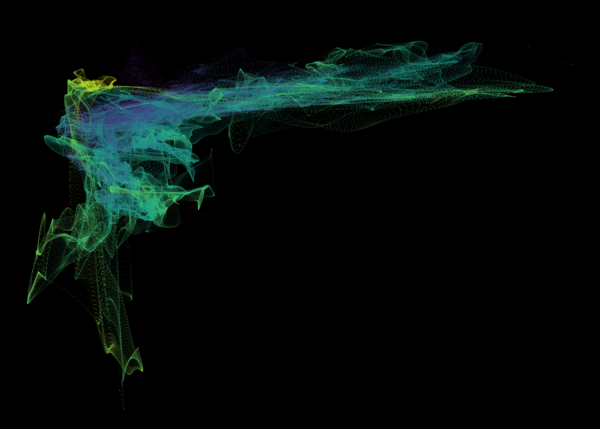
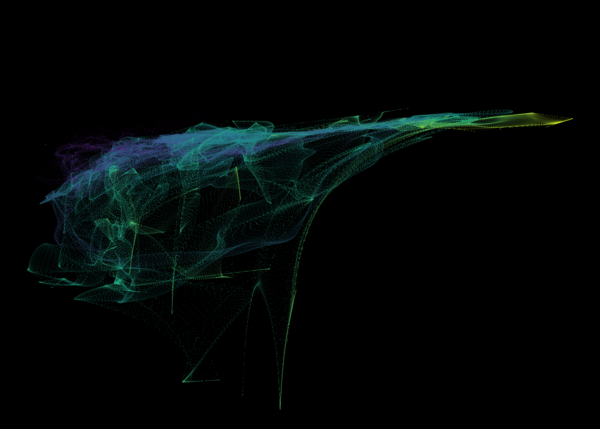
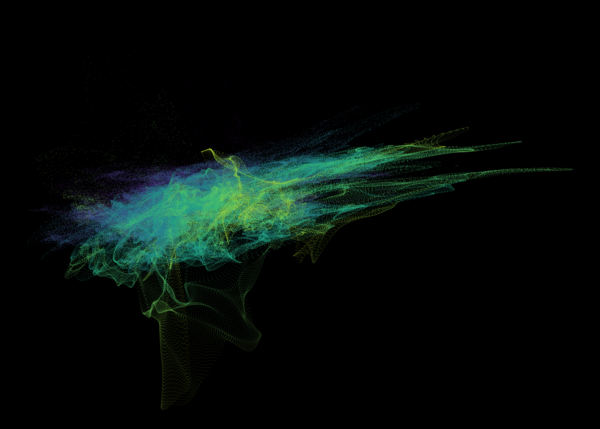
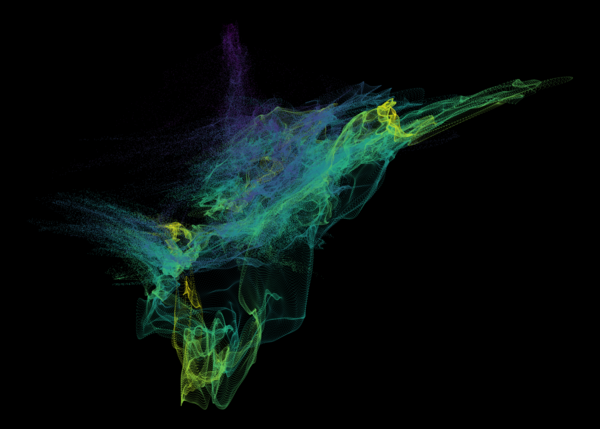
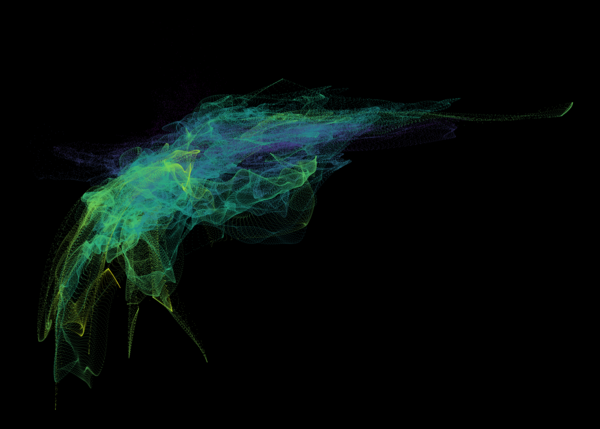
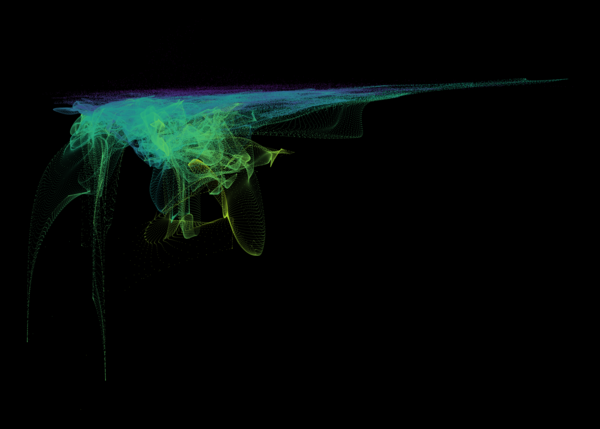
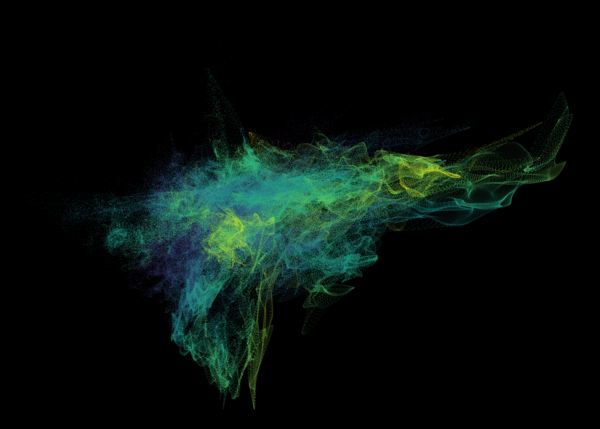
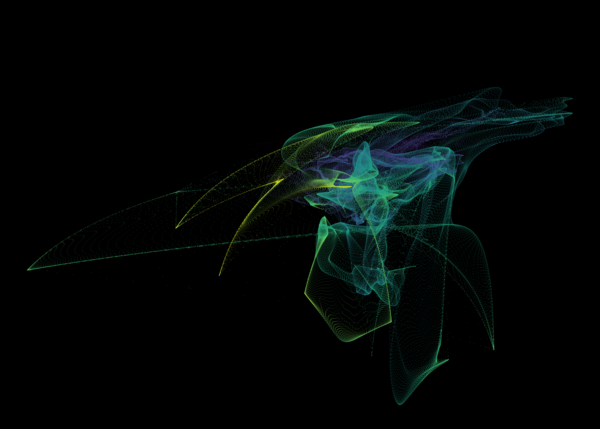
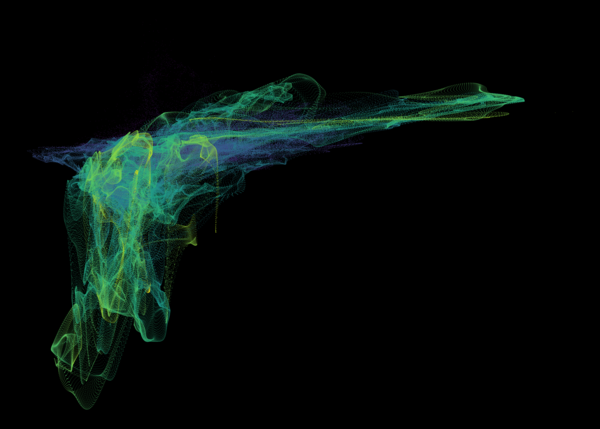
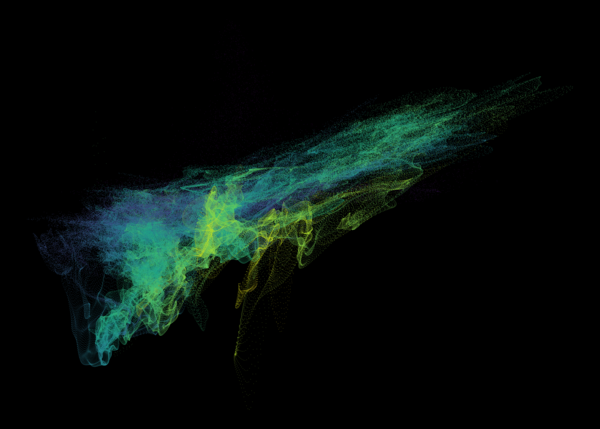
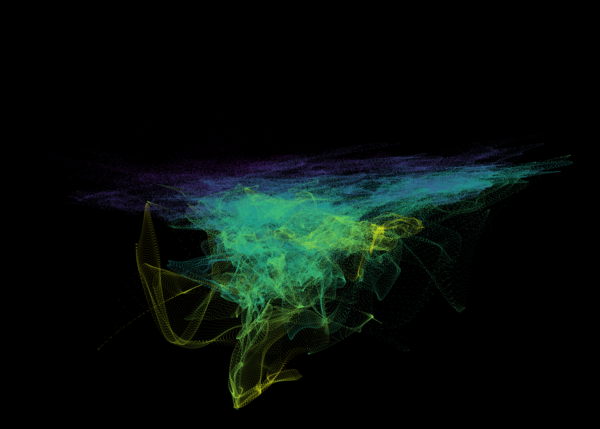
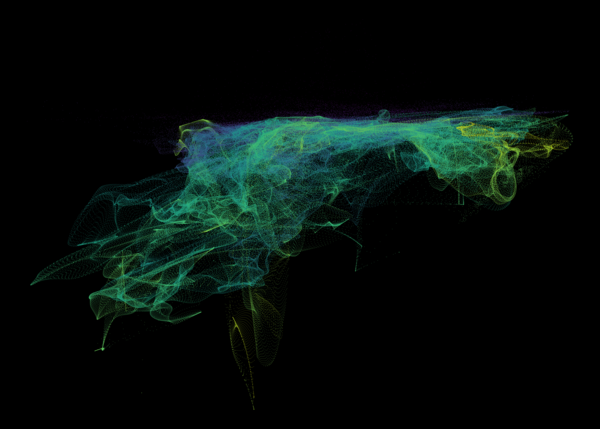
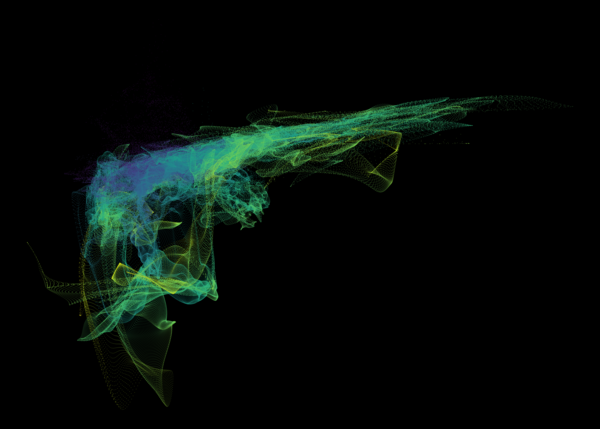
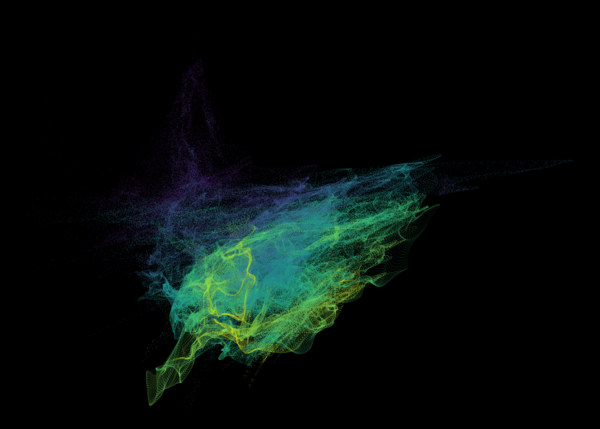
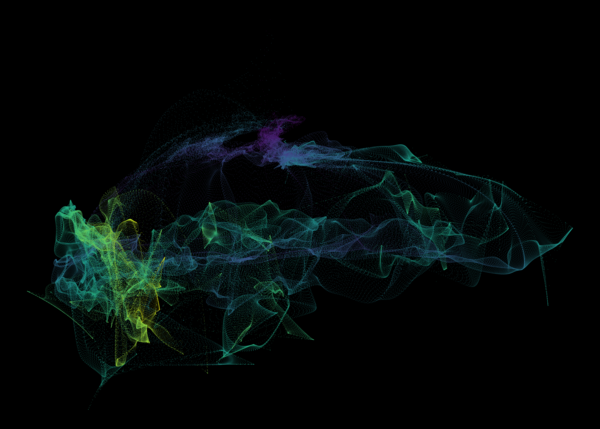
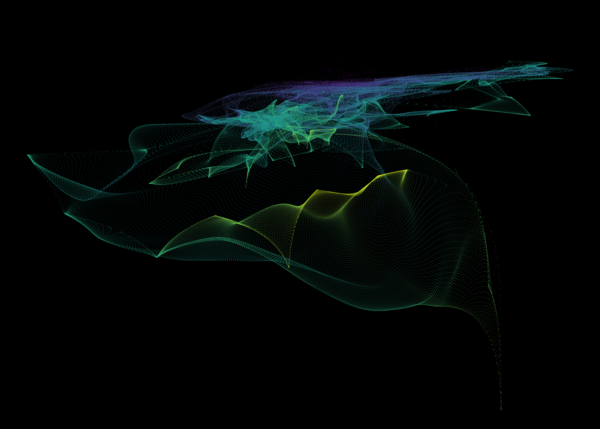
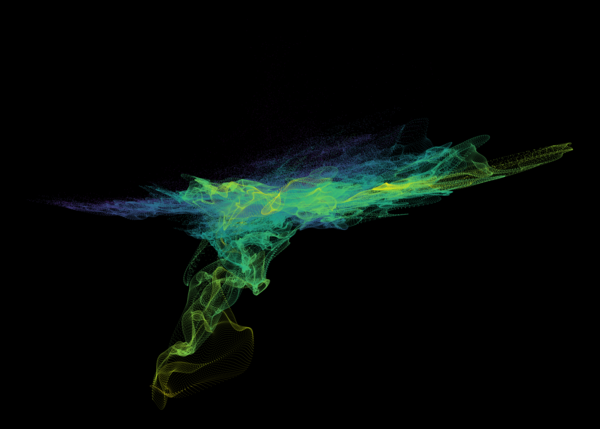
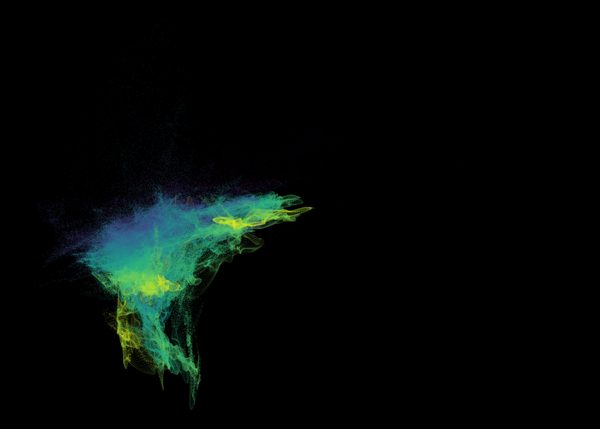
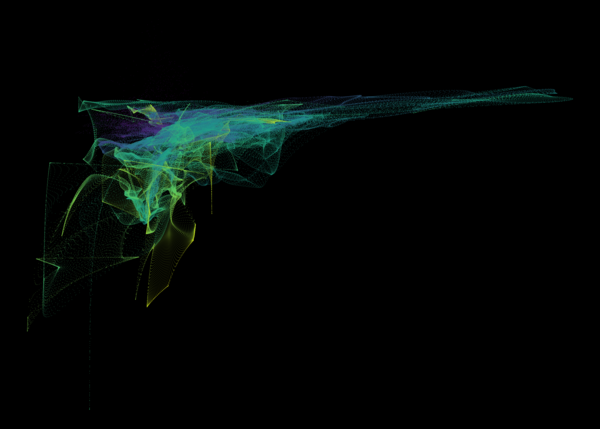
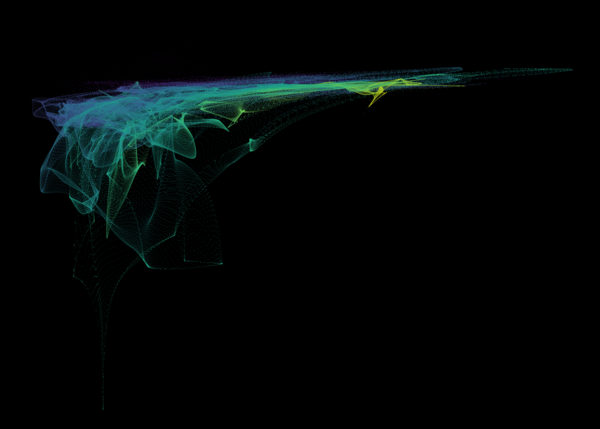
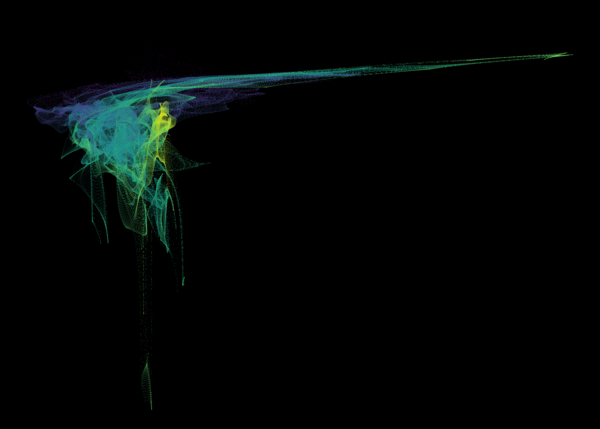
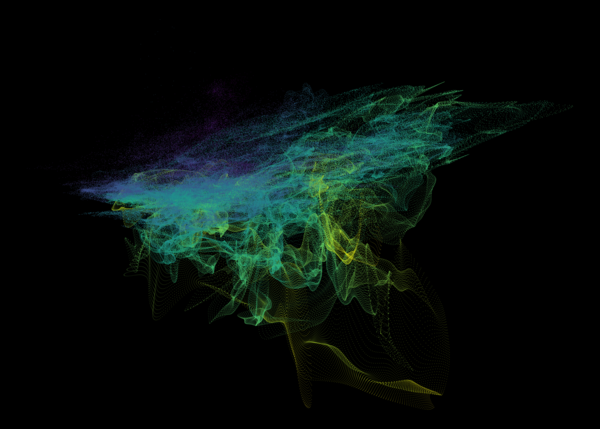
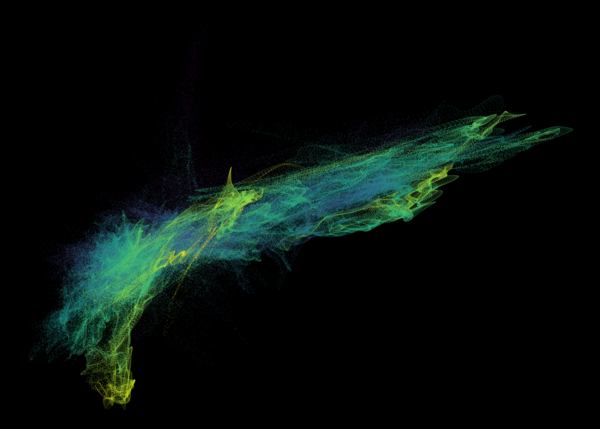
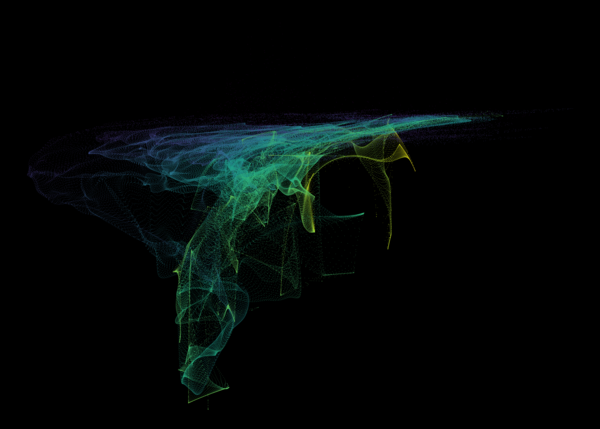
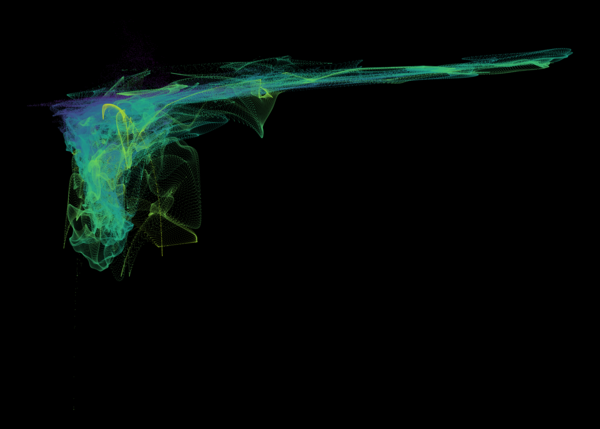
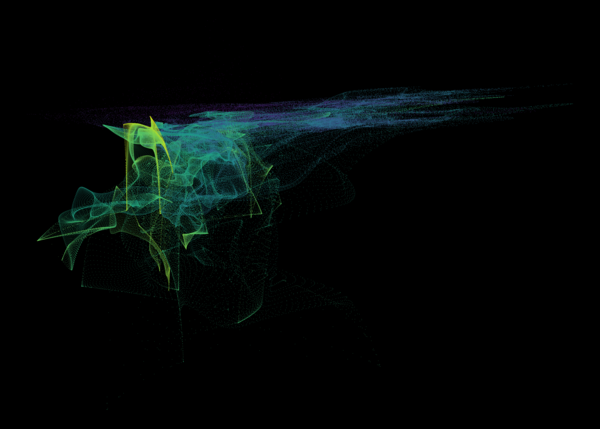
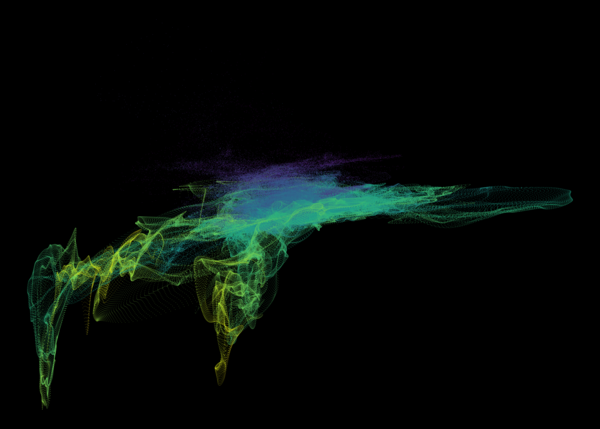
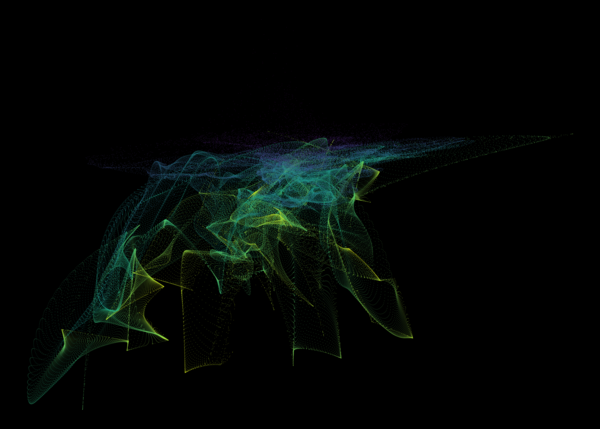
Peroux+ (2020) metallicity vs radial velocity for CGM gas in TNG50.
Pillepich+ (2021) eROSITA-like X-ray bubbles in the CGM of Milky Way/M31-like galaxies in TNG50.
Ramesh+ (2023a) circumgalactic medium of Milky Way/M31-like galaxies in TNG50.
Ramesh+ (2023b) cold clouds in the CGM of TNG50 Milky Way/M31-like galaxies.
Pillepich+ (2024) sample of Milky Way/M31-like galaxies from TNG50. Stellar light images.
Pillepich+ (2024) sample of Milky Way/M31-like galaxies from TNG50. Physical properties.
Zinger+ (2023) Zooniverse Cosmological Jellyfish from TNG50 and TNG100.
Bottrell+ (2024) HSC-SSP stellar light mocks from TNG50.
Bottrell+ (2024) idealized stellar light mocks from TNG50.
These figures are similar to Figure 3 from Peroux+ (2020), and show a visualization of gas in the circumgalactic medium of TNG50 z=0.5 galaxies. The y-axis (vertical) direction represents gas metallicity, higher towards the top. The x-axis (horizontal) represents gas radial velocity, with negative (inflowing gas) towards the left, and positive (outflowing gas) towards the right. As a result, the common Γ shape, from the lower left to the upper right, reveals how accreting gas is preferentially low metallicity, while outflowing gas is preferentially metal rich. Color encodes distance, from an impact parameter of 90 kpc (blue) to 110 kpc (yellow).
No more images.