Public Data Access Overview / Background and Important Details
This page contains important overview content from the TNG public data release paper.
Table of Contents
- 1. Simulation Overview
- Description of the Simulations
- Physical Models and Numerical Methods
- Initial Conditions
- Breadth of Simulated Data and Results
- 2. Data Access
- Direct File Download and Example Scripts
- Web-based API
- Remote Data Analysis
- Further Online Tools
- 3. Scientific Remarks and Cautions
- Possible Observational Tensions of TNG Simulation Results
- Numerical Considerations and Issues
- 4. Community Considerations
- Citation Request
- Collaboration and Contributions
- Future Data Releases
1. Simulation Overview
Description of the Simulations
IllustrisTNG is a suite of large volume, cosmological, gravo-magnetohydrodynamical simulations run with the moving-mesh code Arepo (Springel 2010). The TNG project is made up of three simulation volumes: TNG50, TNG100, and TNG300. The first two simulations, TNG100 and TNG300, were introduced in a series of five presentation papers (Springel+ 2018, Pillepich+ 2018, Naiman+ 2018, Nelson+ 2018, Marinacci+ 2018). The third and final simulation of the project is TNG50 (Nelson+ 2019, Pillepich+ 2019). All three simulations are now publicly released. TNG includes a comprehensive model for galaxy formation physics, which is able to realistically follow the formation and evolution of galaxies across cosmic time (Weinberger+ 2017, Pillepich+ 2018a). Each TNG simulation self-consistently solves the coupled evolution of dark matter, cosmic gas, luminous stars, and supermassive blackholes from a starting redshift of $z=127$ to the present day, $z=0$.
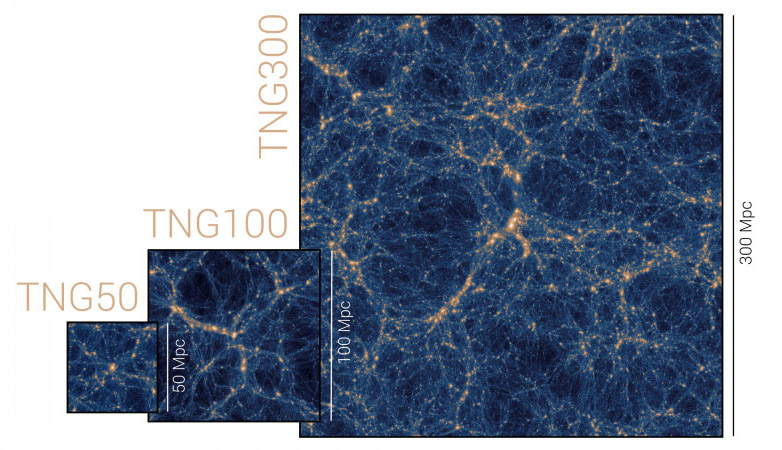
Caption. The three IllustrisTNG simulation volumes: TNG50, TNG100, and TNG300, the name in each case denoting the box side-length in comoving Mpc of the simulation volume. The largest, TNG300, enables the study of rare, massive objects such as galaxy clusters, and provides unparalleled statistics of the galaxy population as a whole. TNG50, with a mass resolution more than one hundred times better, provides for the detailed examination of internal, structural properties and small-scale phenomena. In the middle, TNG100 uses the same initial conditions as the original Illustris simulation, providing a useful balance of resolution and volume for studying many aspects of galaxy evolution.
The IllustrisTNG project is the successor of the original Illustris simulation (Vogelsberger+ 2014, Genel+ 2014, Sijacki+ 2015). Illustris was publicly released in its entirety roughly three and a half years ago (Nelson+ 2015). TNG incorporates an updated 'next generation' galaxy formation model which includes new physics and numerical improvements, as well as refinements to the original model. TNG newly includes a treatment of cosmic magnetism, following the amplification and dynamical impact of magnetic fields, as described below.
The IllustrisTNG project consists of three flagship runs, each accompanied by lower-resolution and dark-matter only counterparts. Three physical simulation box sizes are employed: cubic volumes of roughly 50, 100, and 300 Mpc side length, which we refer to as TNG50, TNG100, and TNG300, respectively. The three boxes compliment each other by enabling investigations of various aspects of galaxy formation. The large physical volume associated with the largest simulation box (TNG300) enables, for instance, the study of galaxy clustering, the analysis of rare and massive objects such as galaxy clusters, and provides the largest statistical galaxy sample. In contrast, the smaller physical volume simulation of TNG50 enables a mass resolution which is more than a hundred times better than in the TNG300 simulation, providing a more detailed look at, for example, the detailed structural properties of galaxies, and small-scale gas phenomena in and around galaxies. Situatied in the middle, the TNG100 simulation uses the same initial conditions (adjusted for the updated cosmology) as the original Illustris simulation. This facilities robust comparisons between the original Illustris results and the updated TNG model. For many galaxy evolution analyses, TNG100 provides an ideal balance of volume and resolution, particularly for intermediate mass halos.
This data release includes the TNG50, TNG100 and TNG300 simulations in full. For each, snapshots at all 100 available redshifts, halo and subhalo catalogs at each snapshot, and two distinct merger trees are released. This includes three resolution levels of the 100 and 300 Mpc volumes, and four resolution levels of the 50 Mpc volume, decreasing in steps of eight in mass resolution (two in spatial resolution) across levels. The highest resolution realizations, TNG50-1, TNG100-1 and TNG300-1, include $2 \times 2160^3$, $2 \times 1820^3$ and $2 \times 2500^3$ resolution elements, respectively. As the actual spatial resolution of cosmological hydrodynamical simulations is highly adaptive, it is poorly captured by a single number. The Figure below therefore shows the distribution of Voronoi gas cell sizes in these three simulations, highlighting the high spatial resolution in star-forming gas -- i.e., within galaxies themselves. In contrast, the largest gas cells occur in the low-density intergalactic medium.
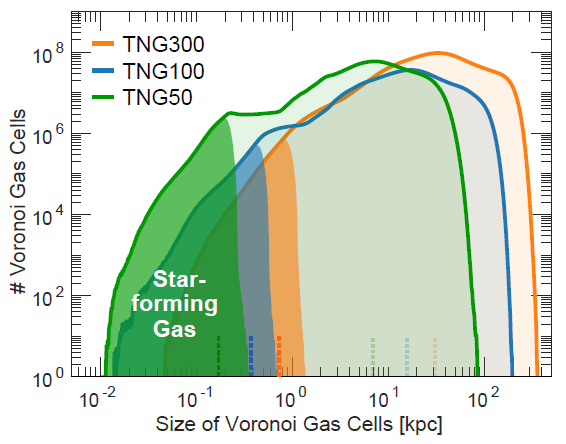
Caption. Spatial resolution of the three high-resolution TNG simulations at $z\sim0$. The dark regions of the distributions highlight star-forming gas inside galaxies, the corresponding median values marked by vertical dotted lines.
All ten of the baryonic runs invoke, without modification and invariant across box and resolution, the fiducial "full" baryonic physics model of TNG. All ten runs are accompanied by matched, dark matter only (i.e. gravity-only) analogs. In addition, there are multiple, high time-resolution, smaller volume "subboxes", with up to 8000 snapshots each and offering time spacings down to one million years.
The table below provides the specifications for each of the ten baryonic TNG runs, as well as the ten dark matter only anlogs, including the gravitational softening lengths and mass resolution values.
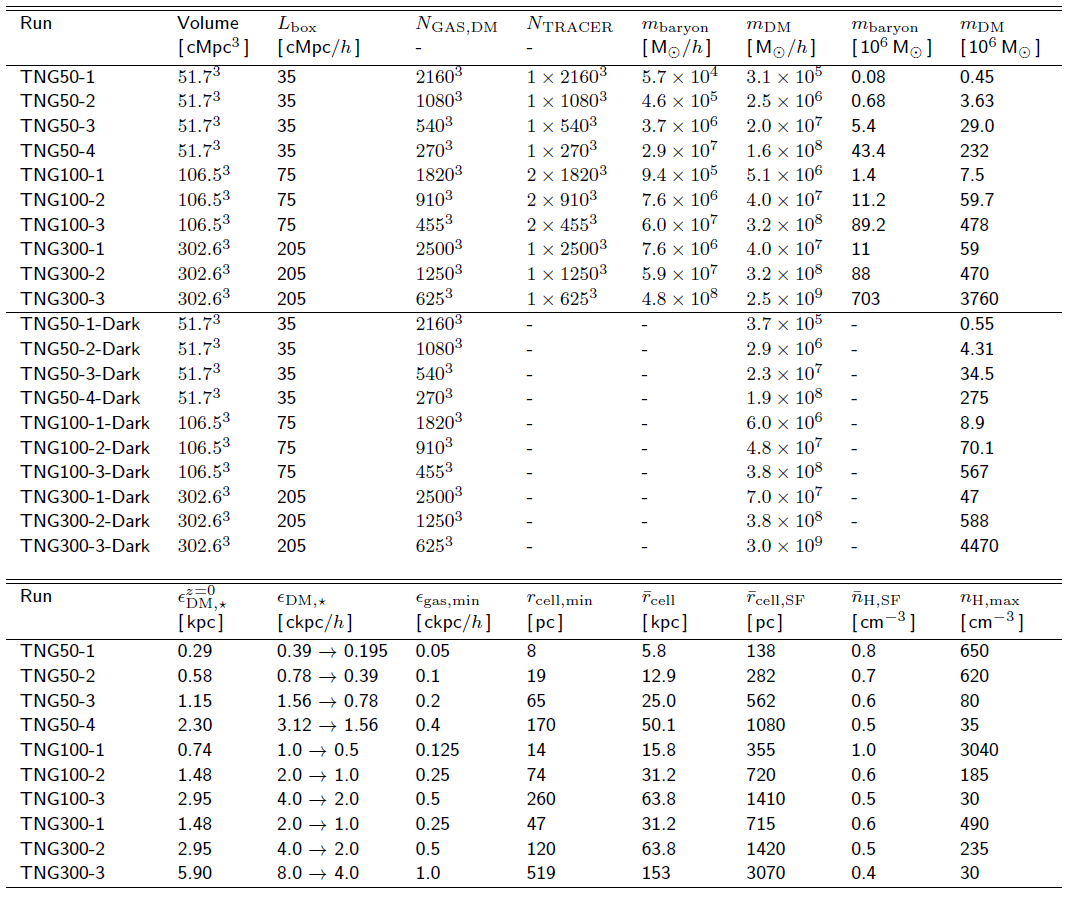
Caption. Table of physical and numerical parameters for each of the resolution levels of the three flagship TNG simulations. The physical parameters are: the box volume, the box side-length (note: TNG100 is erroneously reported as 106.5 Mpc in the published table of Nelson+19), the initial number of gas cells, dark matter particles, and Monte Carlo tracer particles. The target baryon mass, dark matter particle mass, z=0 Plummer equivalent gravitational softening of the collisionless component, the same value in comoving units, and the minimum comoving value of the adaptive gas gravitational softenings. Additional measures of the gas resolution, measured at redshift zero: the minimum physical gas cell radius, the median gas cell radius, the mean radius of star-forming gas cells, the mean hydrogen number density of star-forming gas cells, and the maximum hydrogen gas density.
Physical Models and Numerical Methods
All of the TNG runs start from cosmologically motivated initial conditions, assuming an updated cosmology consistent with the Planck 2015 results ($\Omega_{\Lambda,0}=0.6911$, $\Omega_{m,0}=0.3089$, $\Omega_{b,0}=0.0486$, $\sigma_8=0.8159$, $n_s=0.9667$ and $h=0.6774$), with Newtonian self-gravity solved in an expanding Universe. All of the baryonic TNG runs include the following additional physical components:
- Primordial and metal-line radiative cooling in the presence of an ionizing background radiation field which is redshift-dependent and spatially uniform, including self-shielding corrections.
- Stochastic star formation in dense ISM gas above a threshold density criterion.
- Pressurization of the ISM due to unresolved supernovae using an effective equation of state model for the two-phase medium.
- Evolution of stellar populations, with the associated chemical enrichment and mass loss (gas recycling), taking into account SN Ia/II, AGB stars, and NS-NS mergers.
- Stellar feedback: galactic-scale outflows with an energy-driven, kinetic wind scheme.
- Seeding and growth of supermassive black holes.
- Supermassive blackhole feedback: accreting BHs release energy in two modes, at high-accretion rates ("quasar" mode) and low-accretion rates ("kinetic wind" mode). Radiative proximity effects from AGN also affect nearby gas cooling.
- Magnetic fields: amplification of a small, primordial seed field and dynamical impact under the assumption of ideal MHD.
For complete details on the behavior, implementation, parameter selection, and validation of these physical models, see the two TNG methods papers: Weinberger+ (2017) and Pillepich+ (2018a) We note that the TNG model has been designed (i.e. 'calibrated', or 'tuned') to broadly reproduce several basic, observed galaxy properties and statistics. These are: the galaxy stellar mass function and the stellar-to-halo mass relation, the total gas mass content within the virial radius ($r_{500}$) of massive groups, the stellar mass -- stellar size and the BH--galaxy mass relations all at $z=0$, in addition to the overall shape of the cosmic star formation rate density at $z\lesssim10$ - see Pillepich+ (2018a) for a discussion.
The TNG simulations use the moving-mesh Arepo code (Springel 2010) which evolves the equations of continuum magnetohydrodynamics (MHD; Pakmor+ 2011, Pakmor & Springel 2013) coupled with self-gravity. The latter is computed with the Tree-PM approach, while the fluid dynamics employs a Godunov/finite-volume type method, with a spatial discretization based on an unstructured, moving, Voronoi tessellation of the domain. The Voronoi mesh is generated from a set of control points which move with the local fluid velocity modulo mesh regularization corrections. Assuming ideal MHD, an 8-wave Powell cleaning scheme maintains the zero divergence constraint. The previous MUSCL-Hancock scheme has been replaced with a time integration approach following Heun's method, and the original Green-Gauss methods for obtaining linear gradients of primitive fluid quantities has been replaced with a least-squares method, obtaining second order convergence in the hydrodynamics (Pakmor+ 2016). The long-range FFT calculation employs a new column-based MPI-parallel decomposition, while the gravity solver has been rewritten based on a recursive splitting of the N-body Hamiltonian into short- and long- timescale systems (as in GADGET-4). The code is second order in space, and with hierarchical adaptive time-stepping, also second order in time. Of order 10 million individual timesteps are required to evolve the high-resolution runs to redshift zero.
During the simulation we employ a Monte Carlo tracer particle scheme (Genel+ 2013) to follow the Lagrangian evolution of baryons. An on-the-fly cosmic shock finder is coupled to the code (Schaal & Springel 2015). Group catalogs are computed during the simulations and saved for each snapshot using the FoF and Subfind substructure identification algorithms.
Initial Conditions
We provide as part of this release the initial conditions for all TNG volumes as well as the original Illustris volumes. These were created with the Zeldovich approximation and the N-GenIC code. Each IC is a single HDF5 file with self-evident structure: the coordinates, velocities, and IDs of the set of total matter particles at $z = 127$, the starting redshift for all runs. These ICs were used as is for dark-matter only simulations, while for baryonic runs total matter particles were split upon initialization in the usual way, into dark matter and gas, according to the cosmic baryon fraction and offsetting in space by half the mean interparticle spacing. These ICs can be run by e.g. Gadget or Arepo as is, or easily converted into other data formats.
| simulation name | download link | size |
|---|---|---|
| Illustris-1 | ics.hdf5 | 179.7 GB |
| Illustris-2 | ics.hdf5 | 22.5 GB |
| Illustris-3 | ics.hdf5 | 2.8 GB |
| TNG100-1 | ics.hdf5 | 179.7 GB |
| TNG100-2 | ics.hdf5 | 22.5 GB |
| TNG100-3 | ics.hdf5 | 2.8 GB |
| TNG300-3 | ics.hdf5 | 7.3 GB |
| TNG300-2 | ics.hdf5 | 58.2 GB |
| TNG300-1 | ics.hdf5 | 465.7 GB |
| TNG50-1 | ics.hdf5 | 300.3 GB |
| TNG50-2 | ics.hdf5 | 37.5 GB |
| TNG50-3 | ics.hdf5 | 4.7 GB |
| TNG50-4 | ics.hdf5 | 600.7 MB |
Model Validation and Early Findings
TNG has been shown to produce observationally consistent results in several regimes beyond those adopted to calibrate the model. Some examples regarding galaxy populations, galactic structural and stellar population properties include: the shapes and widths of the red sequence and blue cloud of SDSS galaxies (Nelson+ 2018a); the shapes and normalizations of the galaxy stellar mass functions up to $z\sim4$ (Pillepich+ 2018b); the spatial clustering of red vs. blue galaxies from tens of kpc to tens of Mpc separations (Springel+ 2018); the spread in Europium abundance of metal-poor stars in Milky Way like halos (Naiman+ 2018); the emergence of a population of quenched galaxies both at low (Weinberger+ 2018) and high redshift (Hazouhit+ 2018); stellar sizes up to $z\sim2$, including separate star-forming and quiescent populations (Genel+ 2018); the $z=0$ and evolution of the gas-phase mass-metallicity relation (Torrey+ 2018); the dark matter fractions within the extended bodies of massive galaxies at $z=0$ in comparison to e.g. SLUGGS results (Lovell+ 2018); and the optical morphologies of galaxies in comparison to Pan-STARRS observations (Rodriguez-Gomez+ 2018).
The IllustrisTNG model also reproduces a broad range of unusual galaxies, tracing tails of the galaxy population, including low surface brightness galaxies (Zhu+ 2018) and jellyfish, ram-pressure stripped galaxies (Yun+ 2018). The large-volume of TNG300 helps demonstrate reasonable agreement in several galaxy cluster, intra-cluster and circumgalactic medium properties -- for example, the scaling relations between total radio power and X-ray luminosity, total mass, and Sunyaev-Zel'dovich parameter of massive haloes (Marinacci+ 2018); the distribution of metals in the intra-cluster plasma (Vogelsberger+ 2018); the observed fraction of cool core clusters (Barnes+ 2018); and the OVI content of the circumgalactic media around galaxies from low-z surveys including COS-Halos and eCGM (Nelson+ 2018b).
IllustrisTNG is also producing novel insights on the formation and evolution of galaxies. For instance, halo mass alone is a good predictor for the entire stellar mass profile of massive galaxies (Pillepich+ 2018b); the metal enrichment of cluster galaxies is higher than field counterparts at fixed mass and this enhancement is present pre-infall (Gupta+ 2018); star-forming and quenched galaxies evolve across distinct pathways on the galaxy size-mass plane (Genel+ 2018) and exhibit systematically different column densities of OVI ions (Nelson+ 2018b) and different magnetic-field strengths (Nelson+ 2018a) at fixed galaxy stellar mass, as well as different magnetic-field topologies (Marinacci+ 2018). Galaxies oscillate around the star formation main sequence and the mass-metallicity relations over similar timescales and often in an anti-correlated fashion (Torrey+ 2018); the presence of jellyfish galaxies is signaled by large-scale bow shocks in their surrounding intra-cluster medium (Yun+ 2018); baryonic processes affect the matter power spectrum across a range of scales (Springel+ 2018) and steepen the inner power-law total density profiles of early-type galaxies (Wang+ 2018); a significant number of OVII, OVIII (Nelson+ 2018b) and NeIX (Martizzi+ 2018) absorption systems are expected to be detectable by future X-ray telescopes like ATHENA.
IllustrisTNG has also been used to generate mock 21-cm maps (Villaescusa-Navarro+ 2018) and estimates of the molecular hydrogen budget (Diemer+ 2018) in central and satellite galaxies in the local (Stevens+ 2018) as well as in the high-redshift Universe as probed by ALMA (Popping+ in prep). Finally, TNG provides a test bed to explore future observational applications of machine learning techniques: for example, the use of Deep Neural Networks to estimate galaxy cluster masses from Chandra X-ray mock images (Ntampaka+ 2018).
See the up to date List of Results for references. Please note that on this page we provide, and will continue to release, data files accompanying published papers as appropriate. For instance, electronic versions of tables, and data points from key lines and figures, to enable comparisons with other results. These are available with small "[data]" links next to each paper.
Breadth of Simulated Data
All of the observational validations and early results from TNG100 and TNG300 demonstrate the broad applications of the IllustrisTNG simulations. To give a sense of the expansive scope of these simulations, and the potential for wide applications across many areas of galaxy formation and cosmology, the Figure below visualizes the TNG100 simulation at redshift zero. Each slice reveals a view into the synthetic IllustrisTNG universe. Together, they range from purely theoretical quantities to directly observable signatures, spanning across the baryonic and non-baryonic matter components of the simulation: from dark matter, to stars, to cosmic gas. The wealth of available information in the simulation outputs translates directly into the wide range of astrophysical phenomena which can be explored with the TNG simulations.
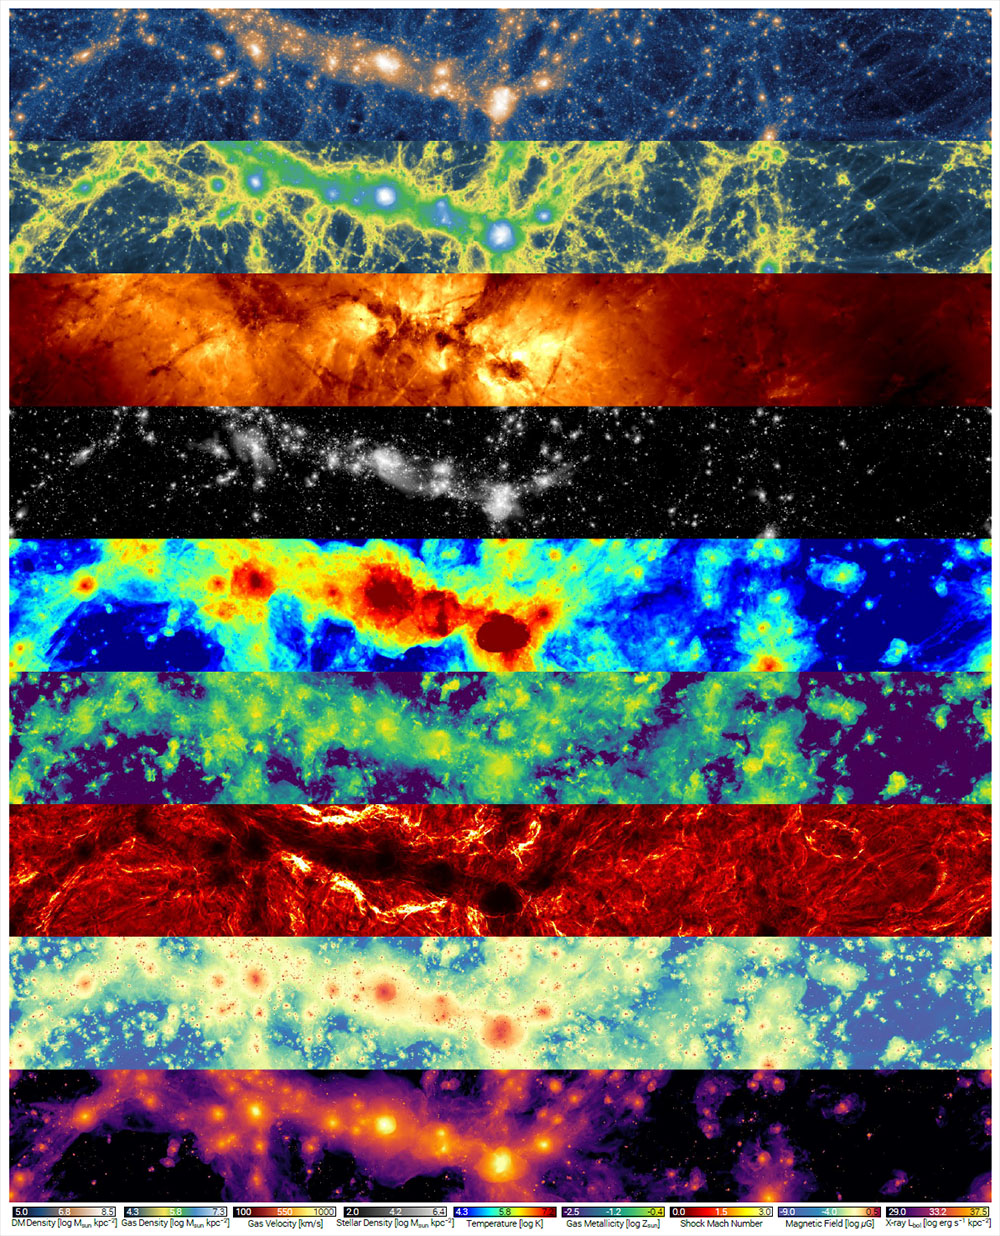
Caption. Overview of the variety of physical information accessible in the different matter components of the TNG simulations. From top to bottom: dark matter density, gas density, gas velocity field, stellar mass density, gas temperature, gas-phase metallicity, shock mach number, magnetic field strength, and x-ray luminosity. Each panel shows the same $\sim 110 \times 14 \times 37$ Mpc volume of TNG100-1 at $z=0$.
2. Data Access
There are three complementary ways to access and analyze TNG data products.
- (Local data, local analysis). Raw files can be directly downloaded, and example scripts are provided as a starting point for local analysis.
- (Remote data, local analysis). The web-based API can be used, either through a web browser or programmatically in an analysis script, to perform search, data extraction, and visualization tasks, followed by local analysis of these derivative products.
- (Remote data, remote analysis). A web-based JupyterLab (or Jupyter notebook) session can instantiated to explore the data, develop analysis scripts with persistent storage, run data-intensive and compute-intensive tasks, and make final plots for publication.
These different approaches can be combined. For example, you may want download the full redshift zero group catalog to perform a complex search which cannot be easily done with the API. After determining a sample of interesting galaxies (i.e. a set of subhalo IDs), you could then extract their individual merger trees (and/or raw particle data) without needing to download the full simulation merger tree (or a full snapshot).
Direct File Download and Example Scripts
Local data, local analysis.
All of the primary outputs of the TNG simulations are released in HDF5 format, which we use universally for all data products. This is a portable, self-describing, binary specification (similar to FITS), suitable for large numerical datasets. File access libraries, routines, and examples are available in all common computing languages. We typically use only basic features of the format: attributes for metadata, groups for organization, and large datasets containing one and two dimensional numeric arrays. To maintain reasonable filesizes for transfer, most outputs are split across multiple files called "chunks". For example, each snapshot of TNG100-1 is split into 448 sequentially numbered chunks. Links to the individual file chunks for a given simulation snapshot or group catalog are available under their respective links on the main data page.
The provided example scripts (in IDL, Python, and Matlab) give basic I/O functionality, and we expect they will serve as a useful starting point for writing any analysis task, and intend them as a `minimal working examples' which are short and simple enough that they can be quickly understood and extended. For a getting-started guide and reference see the Example Scripts Documentation.
Web-based API
Remote data, local analysis.
For TNG we enhance the web-based interface (API) introduced with the original Illustris simulation, augmented by a number of new features and more sophisticated functionality. At its core, the API can respond to a variety of user requests and queries. It provides a well-defined interface between the user and simulation data, and the tools it provides are independent, as much as possible, from any underlying details of data structure, heterogeneity, storage format, and so on. The API can be used as an alternative to downloading large data files for local analysis. Fundamentally, the API allows a user to search, extract, visualize, or analyze a simulation, a snapshot, a group catalog, or a particular galaxy/halo. By way of example, the following requests can be handled by the current API:
- Search across subhalos with numeric range(s) over any field(s) present in the Subfind catalogs.
- Retrieve a snapshot cutout for all the particles/cells within a given subhalo/halo, optionally restricted to a subset of specified particle/cell type(s) and fields(s).
- Retrieve the complete merger history, the main progenitor branch, or the main descendant branch for a given subhalo, for any of the merger trees.
- Download subsets of snapshot files, containing only specified particle/cell type(s), and/or specific field(s) for each type.
- Traverse links between halos and subhalos, for instance from a satellite galaxy, to its parent FoF halo, to the primary (central) subhalo of that group, as well as merger tree progenitor/descendant connections.
- Traverse merger tree progenitor/descendant links across time.
- Render visualizations of any field(s) of different components (e.g. dark matter, gas, stars) of a particular halo/subhalo. (new)
- Download actual data from such a halo/subhalo visualization, for instance a map of projected gas density, O VI column density, or stellar luminosity in a given band. (new)
- Render static visualizations of the complete merger tree (assembly history) of any subhalo. (new)
- Plot the relationship between quantities in the group catalogs, e.g. fundamental scaling relations such as the star-forming main sequence of TNG. (new)
- Plot tertiary relationships between group catalog quantities, e.g. the dependence of gas fraction on offset from the main sequence (the fundamental metallicity relation). (new)
For a getting-started guide, cookbook of examples, and API reference see the Web API Documentation (in IDL, Python, and Matlab).
Remote Data Analysis
Remote data, remote analysis.
Coincident with the TNG public data release we introduce a new, third option for working with and analyzing large simulation datasets. Namely, an online, browser-based scientific computing environment which enables researchers' computations to "be brought to" the data. It is similar in spirit to the SciServer service, i.e. simultaneously hosting petabyte-scale datasets as well as a full-featured analysis platform and toolset. This alleviates the need to download any data, or run any calculations locally, thereby facilitating broad, universal, open access to large cosmological simulation datasets such as TNG.
To enable this functionality we make use of extensive development on Jupyter and JupyterLab over the last few years. JupyterLab is the evolution of the Jupyter Notebook (previously called IPython). It is a next-generation, web-based user interface suitable for scientific data analysis. In addition to the previous 'notebook' format, JupyterLab also enables a traditional workflow based around a collection of scripts on a filesystem, text editors, a console, and command-line execution. It provides an experience nearly indistinguishable from working directly on a remote computing cluster via SSH.
Computation is language agnostic, as "kernels" are supported in all common programming languages, including Python 2.x, Python 3.x, IDL, Matlab, R, and Julia. Development, visualization, and analysis in any language or environment practically available within a Linux environment is possible, although we focus at present on Python 3.x support.
Practically, this service enables direct access to one of the complete mirrors of the Illustris[TNG] data, which is hosted at the Max Planck Computing and Data Facility (MPCDF) in Germany. Users can request a new, on-demand JupyterLab instance, which is launched on a system at MPCDF and connected to the user web browser. All Illustris[TNG] data is then directly available for analysis. A small amount of persistent user storage is provided, so that under-development scripts, intermediate analysis outputs, and in-progress figures for publication all persist across sessions. Users can log out and pick up later where they left off. A base computing environment is provided, which can be customized as needed (e.g. by installing new python packages with either pip or conda). Users can synchronize their pre-existing tools, such as analysis scripts, with standard approaches (git, rsync) or via the JupyterLab interface. Results, such as figures or data files, can be viewed in the browser or downloaded back to the client machine with the same tools.
For security and resource allocation, users must specifically request access to the JupyterLab TNG service. At present we anticipate providing this service on an experimental (beta) basis, and only to active academic users.
Further Online Tools
Subhalo Search Form: We provide the same, simple search form to query the subhalo database as was available in the Illustris data release. It exposes the search capabilities of the API in a user-friendly interface, enabling quick exploration without the need to write a script or URL by hand. As examples, objects can be selected based on total mass, stellar mass, star formation rate, or gas metallicity. The tabular output lists the subhalos which match the search, along with their properties. In addition, each result contains links to a common set of API endpoints and web-based tools for introspection and visualization.
Explore: The 2D Explorer and 3D Explorer interfaces are experiments in the interactive visualization and exploration of large data sets such as those generated by the IllustrisTNG simulations. They both leverage the approach of thin-client interaction with derived data products. The 2D Explorer exposes a Google Maps-like tile viewer of pre-computed imagery from a slice of the TNG300-1 simulation at redshift zero, similar to the original Illustris explorer. Different views of different particle types (gas, stars, dark matter, and blackholes) can be toggled and overlaid, which is particularly useful in exploring the spatial relationships between different phenomena of these four matter components. The 3D Explorer introduces a new interface for TNG, showing a highly derivative (although spatially complete) view of an entire snapshot. That is, instead of particle-level information, we enable interactive exploration of the group catalog output in three-dimensional space. This allows users to rotate, zoom, and move around the cubic box representating the simulation domain, where a largest dark matter halos are represented by wireframe spheres of size equal to their virial radii, while the remaining smaller halos are represented by points. User selection of a particular halo, via an on-click ray cast and sphere intersection testing, launches an API query and returns the relevant halo information and further introspection links. At present, both Explorers remain largely proof of concept interfaces for how tighter integration of numeric, tabular, and visual data analysis components may be combined in the future for the effective exploration and analysis of large cosmological datasets.
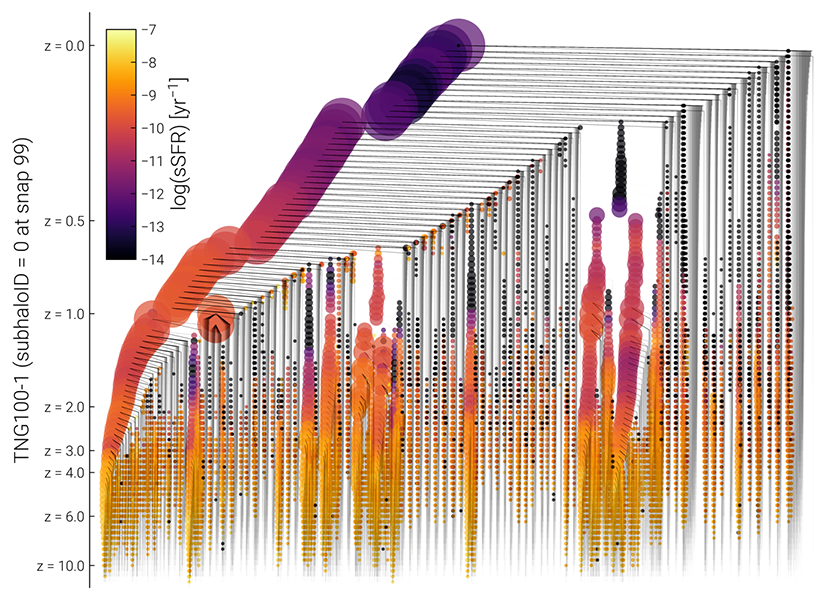
Caption. Example visualization of the complete SubLink merger tree for the most massive halo in TNG100-1 at z=0. Here tree node size is scaled with total halo mass and color mapped to sSFR.
Merger Tree Visualization: In the Illustris data release we demonstrated a rich-client application built on top of the API, in the form of an interactive visualization of merger trees. The tree is vector based, and client side, so each node can be interacted with individually. The informational popup provides a link, back into the API, where the details of the selected progenitor subhalo can be interrogated. This functionality is likewise available for all new simulations. Furthermore, we have added a new, static visualization of the complete merger tree of a subhalo, as shown above for the most massive halo of TNG100-1 at z=0. This allows a quick overview of the assembly history of a given object, particularly its past merger events and its path towards quiescence. In the fiducial configuration, node size in the tree is scaled with the logarithm of total halo mass, while color is mapped to instantaneous sSFR.
Plot Group Catalog: The first significant new feature of the API for the TNG public data release is a plotting routine to examine the group catalogs (see temet). Since the objects in the catalogs are either galaxies or dark matter halos, plotting the relationships among their various quantities is one of most fundamental explorations of cosmological simulations. Classically observed scaling relations, such as Tully-Fisher (rotation velocity vs. stellar mass), Faber-Jackson (stellar velocity dispersion vs. luminosity), the stellar size-mass relation, the star-formation main sequence, or the Magorrian relation (black hole mass versus bulge mass) are all available herein. Such relations can be used to assess the outcome of the simulations by comparison to observational data. More complex relations, those involving currently unobserved properties of galaxies/halos, and/or those only currently observed with very limited statistics or over limited dynamic range, represent a powerful discovery space and predictive regime for simulations such as TNG. At the level of the galaxy (or halo) population, i.e. with tens to hundreds of thousands of simulated objects, many such relationships reveal details of the process of galaxy formation and evolution, as well as the working mechanisms of the physical/numerical models.
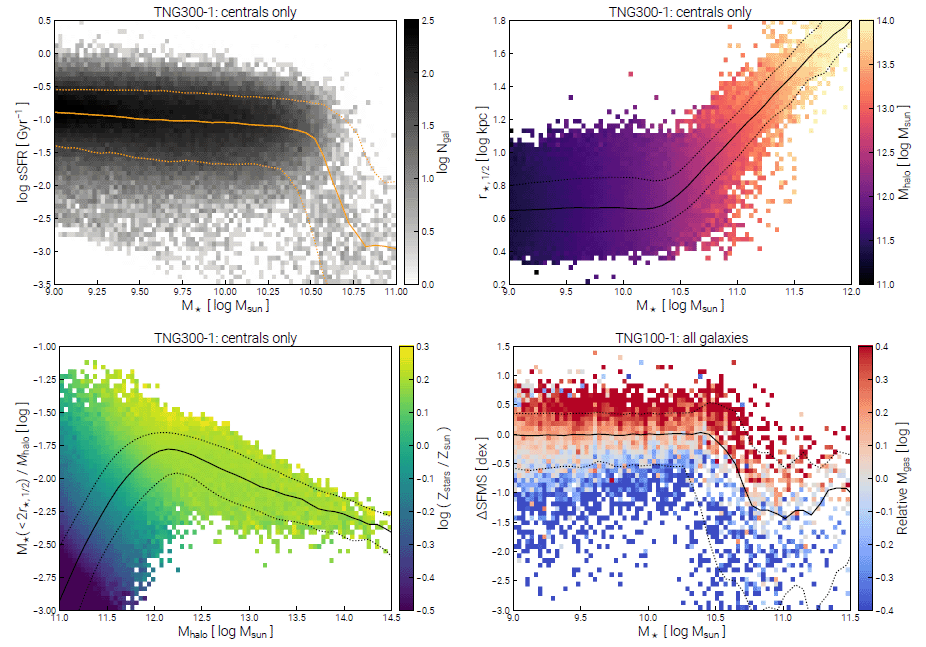
Caption. Four examples of exploratory plots for common scaling relations, galaxy trends, and other relationships between properties of the objects in the group catalogs, galaxies and halos, for TNG300-1 and TNG100-1 at $z=0$. Made using the web-based API functionality. Links into the API for PDF versions of these figures: [upper left], [upper right], [lower left], [lower right].
![[lower left]](http://www.tng-project.org/api/TNG300-1/snapshots/99/subhalos/plot.png?xQuant=mhalo_200_log&yQuant=mstar2_mhalo200_ratio&xlim=11.0,14.5&cQuant=Z_stars&sizeFac=0.8&clim=-0.5,0.3&&minCount=2)
![[lower right]](http://www.tng-project.org/api/TNG100-1/snapshots/99/subhalos/plot.png?xQuant=mstar2_log&yQuant=delta_sfms&cQuant=mgas2&sizeFac=0.8&cenSatSelect=all&xlim=9.0,11.5&ylim=-3.0,1.5&clim=-0.5,0.3&cRel=-0.4,0.4&cRelLog=True)
The "group catalog plotter" is an API endpoint which returns publication quality figures (e.g. PNG or PDF outputs). In the Figure above we show several examples of its output, taken from TNG300-1 and TNG100-1 at z=0. Many options exist to control the behavior and structure of the plots, all of which are detailed in the online documentation. As for the subhalo search form, we also provide a new web-based interface to assist in interactively constructing plots from this service. Fundamentally, the quantities to be plotted against eachother on the x- and y-axes can be selected. In this case, a two-dimensional histogram showing the density of subhalos in this space is overlaid with the median relation and bounding percentiles. Optionally, a third quantity can be added, which is then used to color every pixel in the histogram according to a user-defined statistic (e.g. median) of all the objects in that bin. For example, plotting the stellar mass halo mass relation, colored by star formation rate, reveals one reason for the scatter in this relation. This third quantity can optionally be normalized relative to the median value at each x-axis value (e.g. as a function of stellar mass), highlighting the "relative" deviation of that property relative to its evolving median value. The types of subhalos included can be chosen, for example selecting only centrals or only satellite galaxies, and the subhalos to be included can be filtered based on numeric range selections on a fourth quantity. We expect that this tool will enable rapid, initial exploration of interesting relationships among galaxy (or halo) integral properties, and serve as a starting point for more in-depth analysis.
Visualize Galaxies and Halos: The second significant new feature of the API for the TNG public data release is an on-demand visualization service (see temet). Primarily, this API endpoint renders projections of particle-level quantities (of gas cells, dark matter particles, or stellar particles) for a given subhalo or halo. For example, it can produce gas column density projections, gas temperature projections, stellar line-of-sight velocity maps, or dark matter velocity dispersion maps. Its main rendering algorithm is based on the standard SPH kernel projection technique, with adaptive kernel sizes for all particle types, although alternatives are available. In the Figure below we show several examples of output, at both the halo-scale (circle = virial radius), and the galaxy scale (circle = twice the stellar half mass radius).
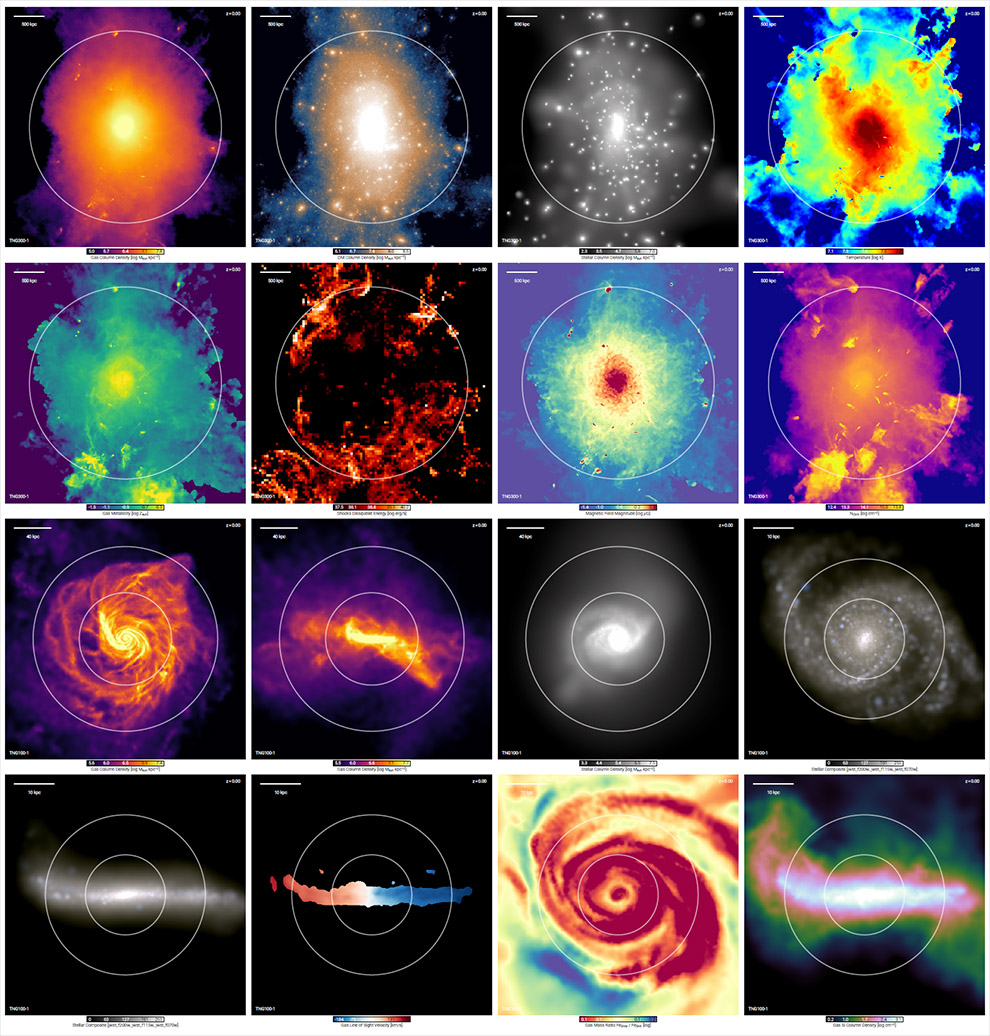
Caption. Example of halo-scale and galaxy-scale visualizations from TNG300-1 and TNG100-1, made using the web-based API functionality, viewing the dark matter, gas, and stars. The top eight panels show the 20th most massive halo of TNG300-1 at z=0 (circle indicating $r_{\rm vir}$). The bottom eight panels show face-on and edge-on views of subhalo 468590 of TNG100-1 at z=0 (circles indicating $r_{\rm 1/2,\star}$ and $2r_{\rm 1/2,\star}$).
The visualization service returns publication quality figures (e.g. PNG or PDF outputs). It can also return the raw data used to construct any image, in scientifically appropriate units (HDF5 output). For instance, a user can request not only an image of the gas density projection of an ongoing galaxy merger, but also the actual grid of density values in units of e.g. $M_{\odot}\, \rm{kpc}^{-2}$. Numerous options exist to control the behavior of the rendered projections, as well as the output style, all of which are detailed in the online documentation. All specifications of the rendering can be specified -- as an example, the view direction can be a rotation into face-on or edge-on orientations. Most properties available in the snapshots can be visualized, for any galaxy/halo, at any snapshot, for any run.
Beyond snapshot level information, the visualization service currently has two somewhat more advanced features. First, it is coupled to the CLOUDY photoionization code, following Nelson+ (2018b). This enables ionic abundance calculations for gas cells on the fly. For example, a user can request a column density map of the O VI or C IV ions. All relevant atoms are supported, assuming solar abundances for non-tracked elements, typically up to the tenth ionization state (Al, Ar, Be, B, Ca, C, Cl, Cr, Co, Cu, F, He, H, Fe, Li, Mg, Mn, Ne, Ni, N, O, P, K, Sc, Si, Na, S, Ti, V, Zn). Emission line luminosities are also available -- a surface brightness map of metal-line emission from O VIII at 22.1012 Å, for example. Secondly, this service is also coupled to the FSPS stellar population synthesis code through python-fsps, following Nelson+ (2018a). This enables emergent stellar light calculations for stellar population particles on the fly, with optional treatments of dust attenuation effects. For example, a user can request a map of stellar surface brightness, or luminosity, either rest frame or observed frame, for any of the ~140 available bands, including common filters on surveys/instruments such as SDSS, DES, HST, and JWST.
We expect that this tool will enable rapid, initial exploration of many interesting facets of galaxies and halos across the simulations, and serve as a starting point for more in-depth analysis. We caution that, used improperly, this tool can easily return nonsensical results (e.g. requesting OI emission properties from ISM gas), and users should understand the relevant scientific limitations. Complete usage documentation is available online.
3. Scientific Remarks and Cautions
In the original Illustris simulation we identified a number of non-trivial issues in the simulated galaxy and halo populations in comparison to observational constraints (see Nelson+ 2015 for a summary). These tensions motivated a series of caveats against drawing strong scientific conclusions in a number of regimes.
In contrast, our initial explorations of TNG (specifically, of the TNG100-1 and TNG300-1 simulations) have revealed no significant tensions with respect to observable comparisons. Furthermore, the TNG simulations have been shown to realistically resolve many aspects of galactic structure and evolution, including the internal properties of galaxies as well as their co-evolution within the cosmic web of large-scale structure. TNG reproduces many observational details and scaling relations related to the demographics and properties of the galaxy population, not only at the present epoch (z=0), but also at earlier times. This has been achieved with a physically plausible although necessarily simplified galaxy formation model. The physical model of TNG is intended to account for most, if not all, of the primary processes that are believed to be important for the formation and evolution of galaxies across cosmic time.
Possible Observational Tensions of TNG Simulation Results
We therefore do not specifically caution against the use of TNG in any of the regimes where the original Illustris simulation was found to be less robust. However, the enormous spatial and temporal dynamic range of these simulations, as well as the multi-scale, multi-physics nature of the complex physical phenomena involved, implies modeling approximations and uncertainties. Early comparisons of TNG against observations have identified a number of interesting regimes in which possible tensions exist.
Our ability to make any stronger statement is frequently limited by the complexity of the observational comparison, i.e. the need to accurately reproduce (or 'mock') the observational measurement closely and with care. In the qualitative sense, however, these regimes may plausibly indicate areas where the TNG model has shortcomings or is less physically realistic. It will be helpful for any user of the public data to be aware of these points, which should be carefully considered when advancing strong scientific conclusions or making claims based on comparisons to observational results.
Possible tensions of interest include the following:
- The simulated stars in Milky Way-like galaxies are too alpha-enhanced in comparison to observations of the Milky Way (Naiman+ 2018).
- The Eddington ratio distributions of massive blackholes ($> 10^9\, {\rm M}_{\odot}$) at $z=0$ are dominated in TNG by low accretion rates, generically far below the Eddington limit; recent observations favor at least some fraction of higher accretion rate massive blackholes. This is reflected in a steeper hard X-ray AGN luminosity function at $1 \lesssim z \lesssim 4$ (Habouzit+ 2018).
- TNG galaxies may have a weaker connection between galaxy morphology and color than observed at $z\sim0$, reflected in a possible excess of red disk-like galaxies in the simulations (Rodriguez-Gomez+ 2018, although see Tacichella+ 2019).
- TNG galaxies exhibit a somewhat sharper trend than observations in quenched fraction vs. galaxy stellar mass for $M_\star \in 10^{10-11}{\rm M}_{\odot}$ (Donnari+ 2019 and Donnari+ 2020b), and similarly in the relation between sSFR and $M_{\rm BH}$ at low redshift (Terrazas+ 2020).
- The locus of the galaxy star-forming main sequence is below the face-value observed SFMS at $1 \lesssim z \lesssim 2$, modulo known inconsistencies with e.g. the observed stellar mass function (Donnari+ 2019a).
- Similarly, the H$_2$ mass content of massive TNG galaxies at $z=1-3$ may be lower than implied by ALMA observations (Popping+ 2019) and sub-mm galaxy demographics (Hayward+ 2020).
- The DM fractions within massive elliptical galaxies at $z=0$ are consistent with observations at large galactocentric distances, but may be too high within their effective radii (Lovell+ 2018) and likewise are on the high-end of values inferred from observations of massive $z=2$ star forming galaxies (Lovell+2018 and Uebler+ 2021).
With respect ot the third and fourth points there is, in general, a very interesting transitional mass regime (galaxy stellar mass $\sim 10^{10.5} {\rm M}_{\odot}$) where central blue vs. red galaxies or star-forming vs. quiescent galaxies co-exist: this reflects the effective quenching mechanism of the TNG model based on SMBH feedback, but how precisely such transitional galaxies differ also in other structural and kinematical problem needs still to be carefully examined.
Note that for the items in this list we have not included more specific quantification of observed tension (i.e. chi-squared or fractional deviation values) -- the referenced papers contain more discussion. On the one side, not all observational results are in agreement among each other, making quantitative statements necessarily partial; nor observational statements of different galaxy properties are necessarily consistent within one another, especially across cosmic times. On the other side, excruciating care is often necessary to properly map simulated variables into observationally-derived quantities.
Numerical Considerations and Issues
To better inform which features of the simulations should be trusted when making science conclusions, note also the following points more directly related to numerical choices:
1. SubhaloFlag. Not all objects in the Subfind group catalogs should be considered "galaxies". In particular, not all satellite subhalos have a cosmological origin, in the sense that they may not have formed due to the process of structure formation and collapse. Rather, some satellite subhalos will represent fragments or clumps produced through baryonic processes (e.g. disk instabilities) in already formed galaxies, and the Subfind algorithm cannot a priori differentiate between these two cases. Such non-cosmological objects are typically low mass, small in size, and baryon dominated (i.e. with little or no dark matter), residing at small galactocentric distances from their host halos, preferentially at late times (z < 1). These objects may appear as outliers in scatter plots of typical galaxy scaling relations, and should be considered with care.
We have added a SubhaloFlag field to the group catalogs to assist in their identification, which was constructed as follows. First, a variant of the SubLink merger tree was used which tracks baryonic, rather than dark matter, particles -- namely, star-forming gas cells and stars. The algorithm is otherwise the same, with the same weighting scheme for determining descendants/progenitors, except that this 'SubLinkGal tree allows us to track subhalos which contain little or no dark matter.
Then, we flag a subhalo as non-cosmological if all the following criteria are true:
- (i) the subhalo is a satellite at its time of formation,
- (ii) it forms within 1.0 virial radii of its parent halo, and
- (iii) its dark matter fraction, defined as the ratio of dark matter mass to total subhalo mass, at the time of formation, is less than 0.8.
These are relatively conservative choices, implying a low false positive rate. On the other hand, some spurious subhalos may not be flagged under this definition. A much more aggressive criterion would be to flag a subhalo if its instantaneous dark matter fraction is low, e.g. less than 10% (as used in Pillepich+ 2018b and Genel+ 2018a). Such a selection will result in a purer sample, with less contaminating subhalos, but will also exclude more genuine galaxies, such as those which have undergone extensive (i.e. physical) stripping of their dark matter component during infall. We encourage users to enforce the provided SubhaloFlag values as a default, but to carefully consider the implications and details, particularly for analyses focused on satellite galaxy populations or dark-matter deficient systems.
2. Gas InternalEnergy Corrections. In all TNG simulations, the time-variable UVB radiation field of Faucher-Giguerre et al. (2009), in particular the FG11 (2011) version, is enabled only for $z < 6$. Therefore, the ionization state of the IGM above redshift six should be studied with caution, as the usual temperature-density relation will not be present. Two further important technical issues exist for the original InternalEnergy field (i.e. gas temperature) of all TNG simulations. These have been corrected in post-processing, as described below, and the fiducial InternalEnergy field of all snapshots in all TNG simulations has been rewritten with updated values. The original dataset has been renamed to InternalEnergyOld for reference, although we do not recommend its use for any purpose.
The first issue arises in the low-density, low-temperature regime of the intergalactic medium (IGM). Here, due to a numerical issue in the TNG codebase related to the Hubble flow across gas cells, spurious dissipation could occur in underdense gas. In practice, this only affects extremely low density IGM gas in equilibrium between adiabatic cooling and photoheating from the background. The result is a slight upwards curvature in the usual $(\rho,T)$ phase diagram. To correct this issue, we have used one of the TNG model variant boxes (with side length $25 \rm{Mpc}/h$ and $512^3$ resolution) which includes the fix for this issue. The adiabat was then identified in all TNG runs as well as in the corrected simulation by binning the density-temperature phase diagram and locating the temperature of peak gas mass occupancy as a function of density. A multiplicative correction, taken as the ratio between the corrected and uncorrected gas temperatures, is then defined and applied as a function of density, for gas cells with physical hydrogen number density less than $10^{-6} a^{-3} \,\rm{cm}^{-3}$. We further restrict the correction to the low-temperature IGM by smoothly damping $f_{\rm corr}$ to unity by $10^{5.0}$ K as $\log T_{\rm corr} = \log T_{\rm orig} + \log(f_{\rm corr}) w(T_{\rm orig})$ with the window function $w(T_{\rm orig}) = 1 - [\rm{tanh}(5(T_{\rm orig}-5.0))+1]/2$. This issue manifests only towards low redshift, and for simplicity and clarity we apply this correction only for $z \leq 5$ (snapshots 17 and later).
The second issue arises for a very small fraction of low-temperature gas cells with $T < 10^4 \rm{K}$, the putative cooling floor of the model. Here, due to a numerical issue in the TNG codebase related to the cosmological scaling of the energy source term in the Powell divergence cleaning of the MHD scheme (right-most term in Eqn. 21 of Pakmor & Springel 2012) spurious cooling could occur in gas with high bulk velocity and large, local divergence error ($|\nabla \vec{B}| > 0$). In practice, this affects a negligible number of cells which appear in the usual $(\rho,T)$ phase diagram with temperatures less than 10,000 K and densities between the star-formation threshold and four orders of magnitude lower. To correct this issue we simply update the gas temperature values, for all cells in this density range with $\log(T \rm{[K]}) < 3.9$, to the cooling floor value of $10^{4}\,\rm{K}$, near the background equilibrium value. As this issue also manifests only towards low redshift (being most problematic at intermediate redshifts $1 \lesssim z \lesssim 4$), we likewise apply this correction only for $z \leq 5$ (snapshots 17 and later).
Note that for both issues, we have verified in reruns of smaller volume simulations, by applying the fix in correspondingly corrected TNG model variant simulations, that no properties of galaxies or of the galaxy population are noticeably affected by these fixes.
3. Unresolved ISM. The multi-phase model of the interstellar medium in TNG (which is the same as in Illustris) is a necessarily coarse approximation of a complex physical regime. In particular, the cold neutral and molecular phases of the ISM are not resolved in the current generation of cosmological simulations like TNG; giant molecular clouds (GMCs) and the individual birth sites of massive star formation and, for example, the resultant nebular excitation is likewise not explicitly resolved. Modeling observables which arise in dense ISM phases (e.g. CO masses) should be undertaken with care.
4. SMBH Existence. The seeding (formation) model for supermassive black holes is such that all galaxies residing in halos above a certain mass host one SMBH, by construction. That is, the black hole occupation fraction above this mass equals one, while below this mass it equals zero. In addition, the dynamics of SMBHs are not followed in detail: they are intentionally kept positioned in the centers of halos. No off-center, wandering, or kicked SMBHs should be expected. Finally, due to the fact that two SMBHs promptly merge when they come close enough to each other, SMBHs can be removed from satellite galaxies (and thus backsplash galaxies) if their orbits bring them close enough to a massive central galaxy. As a result, SMBHs may be artifically removed from galaxies in dense environments (see Borrow+ 2022 for more details).
5. Resolution Convergence Numerical convergence is a complex issue, and working with simulations at multiple resolutions can be challenging. Analysis which includes more than one TNG box at once (e.g. TNG100 and TNG300 together), or explicitly uses multiple realizations at different resolutions should carefully consider the issue of convergence. The degree to which various properties of galaxies or the simulation as a whole is converged depends on the specific property, as well as the mass regime, redshift, and so on. For example, see Pillepich+ 2018b for convergence of the stellar mass functions of TNG100 and TNG300, and details on a simple 'resolution correction' procedure which may be desirable to apply, particularly when combining the results of multiple flagship boxes together into a single analysis.
4. Community Considerations
Citation Request
To support proper attribution, recognize the effort of individuals involved, and monitor ongoing usage and impact, we request the following:
Any publication making use of data from the TNG100/TNG300 simulations should cite the release paper (Nelson et al. 2019a) as well as the five papers from the "introductory paper series" of TNG100/300, the order being random:
- Pillepich et al. (2018b) (stellar contents),
- Springel et al. (2018) (clustering),
- Nelson et al. (2018a) (colors),
- Naiman et al. (2018) (chemical enrichment),
- Marinacci et al. (2018) (magnetic fields).
Any publication using data from the TNG50 simulation should also cite the data release paper (Nelson et al. 2019a), as well as the two introductory papers of TNG50, the order being random:
- Nelson et al. (2019) (outflows),
- Pillepich et al. (2019) (structure & kinematics).
Any publication referring to the underlying physical galaxy formation model and its numerical details can cite the two TNG methods papers:
Finally, use of any of the supplementary data products should include the relevant citation. A list of current and upcoming data catalogs can be found on the data specifications page, along with the requested citation(s).
To avoid confusion: please refer to the project as "IllustrisTNG" or "TNG" for short, not "Illustris-TNG" or other variations. Please refer to the individual simulations as "TNG50", "TNG100" and "TNG300", i.e. "of the IllustrisTNG project", and not e.g. "IllustrisTNG100" or other variations.
You are also welcome to include the following text in an Acknowledgements section: "The IllustrisTNG simulations were undertaken with compute time awarded by the Gauss Centre for Supercomputing (GCS) under GCS Large-Scale Projects GCS-ILLU and GCS-DWAR on the GCS share of the supercomputer Hazel Hen at the High Performance Computing Center Stuttgart (HLRS), as well as on the machines of the Max Planck Computing and Data Facility (MPCDF) in Garching, Germany."
Collaboration and Contributions
The full snapshots of TNG50-1, TNG100-1, and especially those of TNG300-1, are sufficiently large that it may be prohibitive for most users to acquire or store a large number. We note that transferring $\sim\,$1.5 TB (the size of one full TNG100-1 snapshot) at a reasonably achievable 10 MB/s will take roughly 48 hours, increasing to roughly five days for a $\sim\,$4.1 TB full snapshot of TNG300-1. As a result, projects requiring access to full simulation datasets, or extensive post-processing computations beyond what are being made publicly available, may benefit from closer interaction with members of the TNG collaboration.
We also welcome suggestions, comments, or contributions to the data release effort itself. These could take the form of analysis code, derived data catalogs, etc. For instance, interesting data products can be released as a 'supplementary data catalog'. Fast analysis routines which operate on individual halos/subhalos can be integrated into the API, such that the result can be requested on demand for any object.
Future Data Releases
We anticipate the ongoing release of additional data products, for which further documentation will be provided online:
Rockstar and Velociraptor. We plan to derive and release different group catalogs, based on the Rockstar and Velociraptor algorithms, and will provide further documentation at that time. Such group catalogs will identify different subhalo populations than found by the Subfind algorithm, particularly during mergers. The algorithm used to construct the 'Consistent Trees' assembly histories also has fundamental differences to both LHaloTree and SubLink. This can provide a powerful comparison and consistency check for any scientific analysis. We also anticipate that some users will simply be more familiar with these outputs, or need them as inputs to other tools.
Additional Simulations: The flagship volumes of the IllustrisTNG -- TNG50, TNG100, and TNG300 -- are accompanied by an additional resource: a large number of 'TNG Model Variation' simulations. Each modifies exactly one choice or parameter value of the base, fiducial TNG model. The variations cover every physical aspect of the model, including the stellar and blackhole feedback mechanisms, aspects of the star formation, as well as numerical parameters. They are invaluable in assessing the robustness of a physical conclusion to model changes, as well as in diagnosing the underlying cause or mechanism responsible for a given feature in the primary simulations. They were first presented in the Pillepich et al. (2018a) TNG methods paper, and used for example in Nelson et al. (2018b) to understand the improvement in OVI column densities, in Lovell et al. (2018) to study the impact of baryons on dark matter fractions, and in Terrazas et al. (in prep) to probe the origin of quenched galaxies in the TNG model.
Each of the ~100 TNG model variants simulates the exact same $25 {\rm Mpc}/h$ volume at a resolution equivalent to the flagship TNG100-1. Individual halos can also therefore be cross-matched between the simulations, although the statistics is necessarily limited by the relatively small volume. We anticipate to publicly release these variations in the near future, and encourage those interested to get in touch in the meantime.
Finally, we anticipate that ongoing and future simulation projects will also be released through this platform in the future.
API Functionality Expansion: There is significant room for the development of additional features in the web-based API. In particular, for (i) on-demand visualization tasks, (ii) on-demand analysis tasks, and (iii) client-side, browser based tools for data exploration and visualization. We have two specific services which are anticipated to be developed in the near-term future and made available.
First, the on-demand generation of 'zoom' initial conditions (ICs), for individual galaxies/halos, based on any object of interest selected from any simulation box. This will allow a user to select a sample of galaxies, perhaps in analogy to an observed sample, or with a peculiar type of assembly history, and obtain ICs for resimulation. Such resimulations could use other codes or galaxy formation models, or explore model parameter variations, to assess how such changes affected a particular galaxy/halo, or class of galaxies/halos. As IC generation will take several minutes at least, it does not fit within our current framework of `responses within a few seconds', and therefore requires a delayed execution and subsequent notification (e.g. via email) of completion and the availability of new data products for download.
Second, the on-demand execution of longer running analysis tasks, with similar notification upon completion. Specifically, the ability to request SKIRT radiative-transfer calculations for specific galaxies/halos of interest. Other expensive mocks, such as spectral HI (with Martini) or x-ray datacubes (with pyXSIM), or intergalactic quasar absorption sightlines, could similarly be generated.
We welcome community input and/or contributions in any of these directions, or comments related to any aspect of the public data release of TNG.